


Copado and CodeScan support, improved sObjects editor in Blaze R11
You might think that The Welkin Suite Blaze is again a couple weeks behind the Bloom version for Windows? Kinda, but today we're releasing 2 versions in 1, so some of the newest, coolest things will be available even before the Windows version - like built-in support for the great CodeScan tool, significant performance and UI updates for the Field-Level Security and Local History Details. And at the same time, a lot of improvements for release management and deployment functionality are also available for you now - Copado integration, and enhanced tracking of changes. Are you still thinking that this is not worth a month of waiting? Well, you also have now a new Cloning Fields options, built-in formulas editor with code completion, and a couple more changes.

Check it out for yourself and let us know what do you think about all the new and updated stuff in The Welkin Suite Blaze R11!
Release management and task tracking one click away with built-in Copado support
When you just start a development - writing code (or making changes in the Salesforce UI) seems to be the whole universe. But a bit later you realize that working with all the requirements and testing your code takes up its time too. Moving forward you start thinking about having backups, tracking changes, e.g. - version control. Even later, when you start working with a team or on multiple porjects/tasks at the same time - you can't keep track of everything in your head, and you want some task tracking system... Yup, by this moment "development" rarely exceeds 60% of your time, right? 
Too long of an intro, we know, but it is really needed. Version control, task tracking, changes management, and deployments - all of this is very important for development, and there is a lot of different ways, and tools to handle all these tasks. This is why in the Blaze R11 we are introducing support for one of the best services that handles all of this tasks at once - Copado. If you haven't tried it yet - get a free trial, so you'll be able to go through the details on how to use Copado in The Welkin Suite together with us.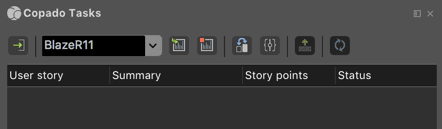
The Copado journey in the IDE starts from the special pad called 'Copado tasks' (you can enable it from the application menu 'View → Pads → Copado tasks').
Once you open the pad for the first time you'll see nothing interesting but the 'Login' button. Clicking on it will open a wizard that will help you connect to your Copado-enabled organization with The Welkin Suite.
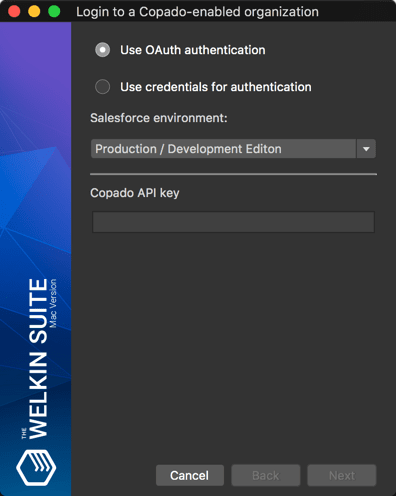
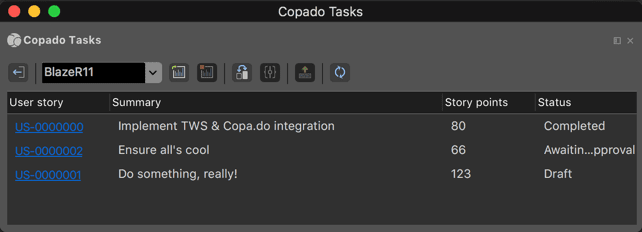
After entering the credentials for a Salesforce organization, you will also need to enter a Copado API - you can get this if you'd login to the org, open the 'Account Summary' tab, and switch to the 'API key' subtab. Once you're done with this, the IDE will verify the credentials and the API Key, and then it will display the Copado user stories from your org, with the following details:
- 'User story' - Name or key of the user story. This is a clickable link that will open the story in your browser so you can look for more details;
- 'Summary' - Summary of the story, so you'd not forget what is it about;
- 'Story points' - Story points estimation for the story;
- 'Status' - Current status of the story.
You can also edit 'Story points' and 'Status' values right in the pad, in exactly the same way as you can do this in the SOQL Executor - double-click on a cell, enter a new value and hit the 'Upload changes' button to apply them.
Let's now take a look at what else you can do in this pad, and how it can be used to make your development life somehow easier. And we'll start with the toolbar and options it provides:
- 'Login' or 'Logout' button that is used to login to your Copado-enabled organization where all the release management magic happens;
- Project selection dropdown;
- 'Start tracking changes' / 'Restart tracking changes' button that is used to track changes that you do within the IDE (see below in more details);
- 'Stop tracking changes' - to stop tracking changes;
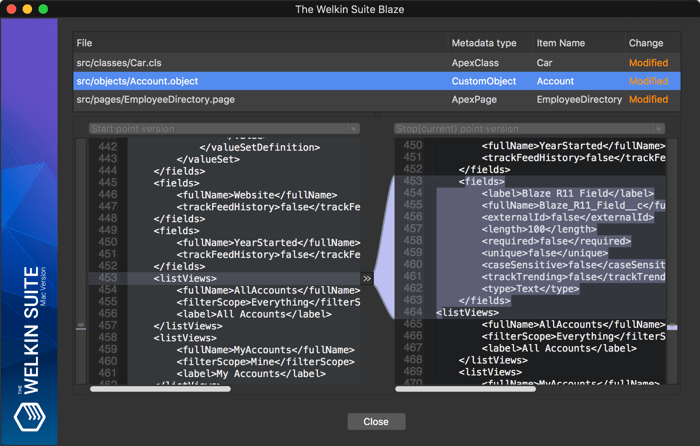
- 'Show difference' - to see the changes you've made since you started tracking changes;
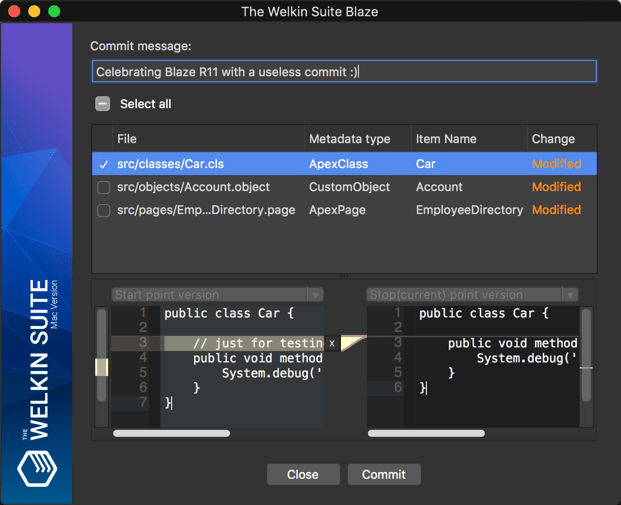
- 'Commit' - to commit your changes to Copado;
- 'Upload changes' - to apply changes that you've made on stories in the panel;
- 'Refresh' - refreshes the list of tasks from Copado.
If we'd go into more details - once you start tracking changes, the IDE creates a checkpoint (e.g. remembers the current state of your project), so by the moment when you'll finish working on a task, The Welkin Suite will be ready to show you the exact difference of what was changed. Of course, you can examine the changes at any point of time - just click the 'Show difference' button and you will see a full list of changed files with an ability to select any of them and you will see the built-in diff viewer.
When the task (or at least your part of work / your part of work for now) is completed, and you want to commit it to Copado and Git - press the 'Commit changes' button, where you will see a very similar difference viewer, and you'll have an ability to enter a commit message. Don't forget to select a task beforehand - commits are tied up with tasks, while tasks are tied up with Org Credentials (in Copado terms), so the IDE won't allow you to commit changes without selecting a task that is tied up to the same org as your selected project.
Just to summarize the flow that you are now able to follow right from the IDE, without any additional actions:
- Select the correct task in the 'Copado tasks' pad, and update it's status to the one that's used in your team (we assume it's something like 'In Progress')
- If needed - link the user story with Org Credentials, according to the org where you're going to work on the user story
- Start tracking changes in The Welkin Suite
- Do your great stuff
- Once ready - commit your changes to Copado (and linked Git repository) directly from the IDE
- Stop tracking changes, if you don't need this anymore
There never can be "too much" when talking about code quality - make it even better with CodeScan support
Built-in support for two great services in just 4 weeks since the last release? Exactly!
We've received a lot of feedback from developers since we implemented PMD support in The Welkin Suite. And due to that, we are treating code quality as one of the very important development aspects, especially if we are talking about something can be done in an automated way! We want to believe that we have introduced this great tool to a lot of teams, so the overall code quality in the Salesforce Ohana has grown... At least for 0.1%
Starting from the Blaze R11, The Welkin Suite supports two awesome code analysis tools for Salesforce, as CodeScan is supported and ready to use right out-of-the-box! Do you know what's so cool about CodeScan? These guys provide more than 225 rules to check your code!
First of all, you'd need to have a valid CodeScan license or at least a not-yet-expired trial, so you can go to The Welkin Suite application menu, select 'Preferences', navigate to the 'External Tools → CodeScan settings' and enter your license into the 'CodeScan license' field.
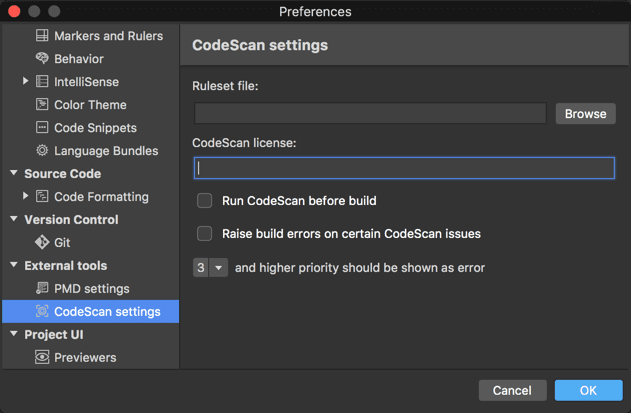
In the same settings window you can setup some general CodeScan configuration:
- Default ruleset file that will be used for all projects without the explicitly specified CodeScan ruleset
- 'Run CodeScan before build' option will execute CodeScan before each build, but only for files that were changed, and are sent to Salesforce
- 'Raise build errors on certain CodeScan issues' will do what it says... really But you'll have to select what rule priority should be treated as an error, and what priority is just a warning
By the way, the overall approach and usage details are the same as for built-in PMD code analysis, so if you've tried it - you won't get lost in the CodeScan support in The Welkin Suite.
Let's do a small step back before we proceed with all the awesomeness that you'll get. There is a couple of ways how you can install CodeScan - including SonarQube, Jenkins, so you'll see a nice web interface and built-in reports. However with The Welkin Suite, everything is much easier - the command-line executable is bundled with the IDE, so you don't need to do anything in terms of installation and additional configuration, and at some point in the future, you will also see the next step of integration including reports from CodeScan.
You can create a ruleset file with the definitions of what rules should be checked using the 'Application menu → Tools → Codescan Apex Ruleset Configuration':
- Open and edit any existing CodeScan ruleset
- Create a new empty ruleset and configure it to exactly fit your needs
- Create a ruleset using the default Villagechief (CodeScan creators) template, where a lot of rules are already pre-configured, however, you still have the full freedom to modify it as you want
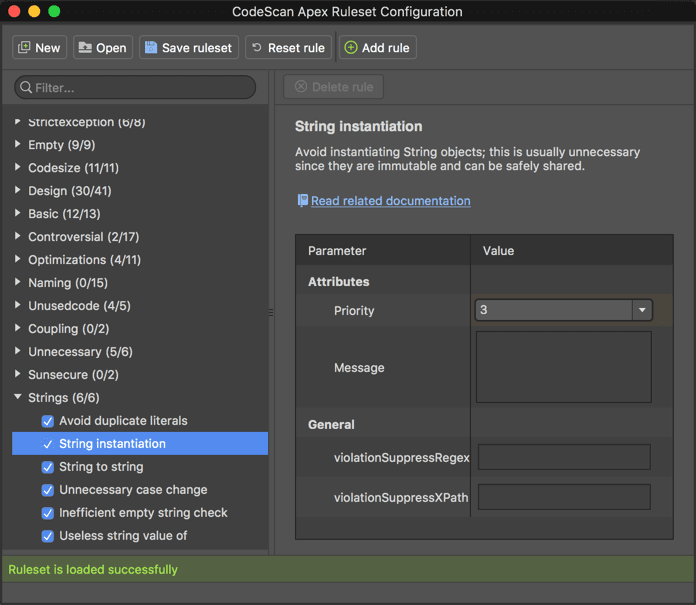
While working with ruleset in the configurator, on the left side, you will see the categories (we won't name all 18 categories here) and corresponding rules beneath each of them. On the right side of the configurator, you will see the configuration details for a selected rule. Then, depending on the rule itself, you might be able to configure different parameters so it will match your vision of good code.
Once everything is configured - save your ruleset, and point The Welkin Suite to it:
- Using the general IDE settings as described above
- Using per-project settings - in a context menu for your project in the Solution pad select 'Options' and navigate to the 'External Tools → CodeScan settings' section
And... That's it! Now you can execute CodeScan analysis manually from the context menu in the Solution pad, or it will be executed automatically as a pre-build step if you've enabled the corresponding setting.
All CodeScan errors and warnings will be shown in the following ways:
- Listed in the special 'CodeScan Report' pad
- Shown in the 'Errors' pad as regular errors and warnings from the IDE
- Highlighted in the code
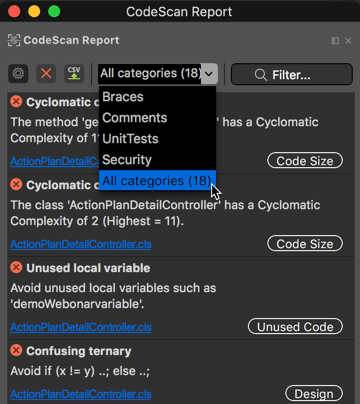
In the 'CodeScan Report' pad, you will get a full list of violations with a short description, category and a name of a file with an issue(clicking on a filename will open it in the editor). Additionally, you can narrow down the list to a certain category and/or use a filter to search for some specific issues. And, finally, you can export a report to a CSV file for the future reference, or to share it with your team!
Now you're for sure ready to start using CodeScan in The Welkin Suite. We are sure that this integration will help you improve your code.
Tracking and deploying changes is even easier than before
Let's do a quick check to see if this new feature is worth your time reading this section? 
Imagine that you start doing a task. A couple changes here, a couple changes there. Then lunch. And back to Salesforce - update a trigger, couple handlers, fix some failing tests, and finally handle that exception on a Visualforce page with some changes to a component, controller, and unit test. Or, maybe, a couple new fields, tune that formula field that was not working correctly in some edge cases, "beautify" some layouts, and added all the new magic to a report. An absolutely common situation, right? And then you find yourself spending at least 20 minutes trying your hardest to remember all changes you've done, so everything will be added to a changeset.
If you remember yourself ever being in such a situation - great, start thinking how else you can spend that 20 minutes from the example above, as you won't need to do this anymore. But first, open the new 'Tracking changes' pad from the 'Application menu → View → Pads → Tracking changes'
![]()
In the example above, before starting working on a task you can press the 'Start' button - a new 'checkpoint' will be created by The Welkin Suite. If you want - you can enter some helpful name for that checkpoint, for example 'TWS-1999 - Increasing code coverage'. The checkpoint that was created is tied up to your project.
So, as you are doing any changes within a project - the IDE tracks all of them and shows in the 'Tracking changes' pad once you hit the 'Reload' button.
![]()
Once you reach that happy momen,t when you are ready to deploy your changes from a sandbox to a production environment (or to another sandbox, for example) - just press the 'Deploy' button.
The 'Deploy' button will open the standard TWS deployment wizard, however, when you'll get to the step where you need to select what exactly needs to be deployed - everything you've worked on will have been already selected by the wizard. This is how you can easily save your changes!
If you have any ideas about how else this list of changes can be used - drop us a few words and we'll be happy to make your ideas real life.
New sObjects Inspector Experience - Cloning fields and Formula editor
We'd say something like 'The sObjects Inspector. Reimagined.' or (already) classical 'Awesome sObjects Inspector. It's amazing!', but we're not one of that technical giants, so we'd rather show you what's new, and you can decide yourself if it's 'amazing' or 'reimagined'
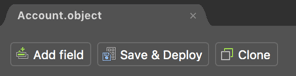
We always treat sObjects as one of the most (if not the most) an important part of Salesforce organizations - everything is built around them. And everything is built to work with them. Thus almost everything that we build for Salesforce influences sObjects and, usually, requires changing them accordingly. Starting from The Welkin Suite Blaze R11 you will find a new button in the 'Fields' tab - 'Clone'.
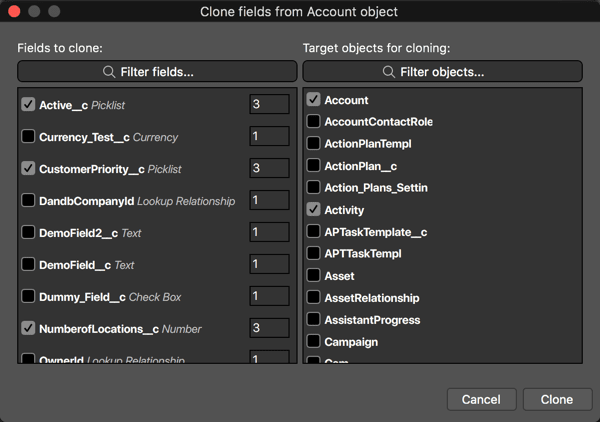
As you'd expect, it allows cloning fields in a very easy and intuitive way without a need to edit the XML files directly. At the same time, while keeping it simple, we've also packed it with a handful of interesting options:
- You can select multiple fields to be cloned
- You can select how many times each field should be cloned into a target object(s)
- You can select one or multiple target objects, even the same one
- And, of course, you can search for fields and objects using filters - it's somehow quicker
After you hit the 'Clone' button, the IDE will modify the corresponding XML file(s) for target object(s) with the cloned field(s), and it will open them in the editor, so you can later fine-tune them.
Having all these options provides you with a way to speed up many common tasks, just to name a few:
- Duplicating a set of fields from one object to another - simply select the needed fields and copy each of them, 1 time to an another object
- Creating repetitive fields (e.g. different phone numbers on a custom object, or those not-looking-good-but-still-inevitable 'Account 1', 'Account 2', 'Account 3', etc.) - select a field and copy it multiple times to the same object
- Create repetitive sets of fields (e.g. multiple addresses, containing Street, City, Zip, Country, for example) - select couple fields and copy them multiple times to the same object
Another change within the same 'Fields' tab is related to editing fields - now you don't need to remember all the API names and different functions that you can use in expressions, like 'ISCHANGED' or 'PRIORVALUE'. the IDE knows about all of them, and from now on, it'll suggest you everything you might need when editing default values for all fields, or when editing your formula fields.
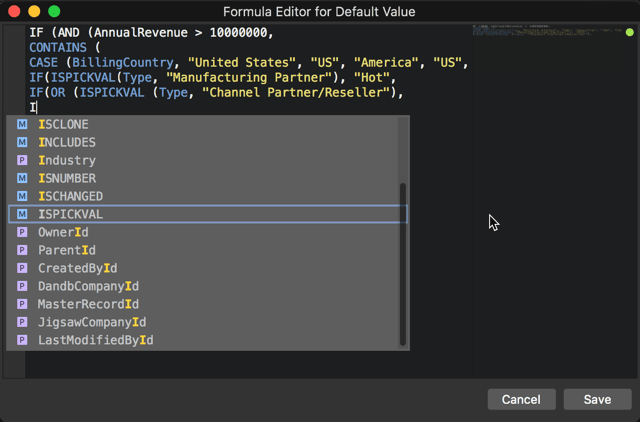
This means that the same expressions editor, as you might have already seen in Validation Rules or in Workflow Rules within the Admin Panel, is now also available for you in the sObjects Inspector, helping you to work with formulas much faster.
One more small change is more like 'finally doing something that should be there from the very beginning', being honest. If you add a new field in the sObjects Inspector - you can now expect the API name field to be completed using the same logic and approach as in Salesforce itself. So you just need to type in the Label, and we'll handle the API name for you.
The new great performance for FLS and Local History
We continue our journey on improving the IDE performance and changing the UI approach to the native Mac UI, and in the past month we've worked on improving the 'FLS' tab in the sObjects Inspector and the 'Local History Details' pad - these two pads are displaying, so much information at once, so previously they were very resource-heavy and caused performance issues in some cases.
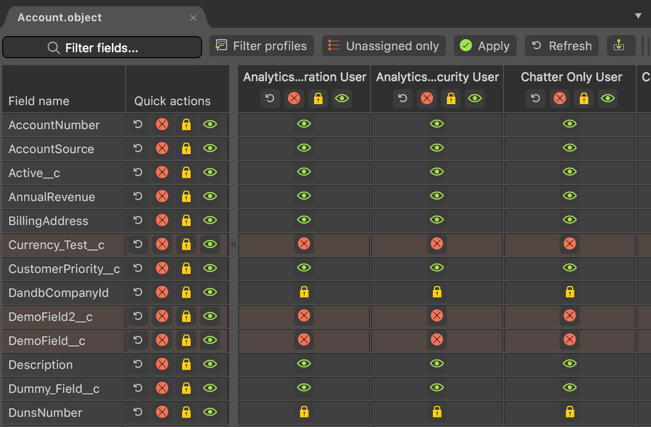
After switching to the new UI approach, their performance is at least 2x times better than it was before. Regarding the 'FLS' tab - it's performance increase is closer to 5x times, however right now it is limited by the 'Fields' and 'Layouts' tab, so once we'll apply the same changes to them, the overall sObjects Inspector performance will be incredibly better!
What is your experience with this changes? Have you noticed these improvements or everything was great even before them?
Other changes
Meantime, the beginning of spring means that there are new updates from Salesforce, and this is the time to also update The Welkin Suite with any new API versions. In a frame of the Blaze R11 version, we have moved the IDE to support the Salesforce API v. 42. So now you can start using all new abilities and elements, provided by SF, for your TWS project. Also, we have updated our database for the code assistance functionality to include all new objects, types, fields, etc., according to these changes, to extend the list of suggestions for your coding, and make your development process more fluent.
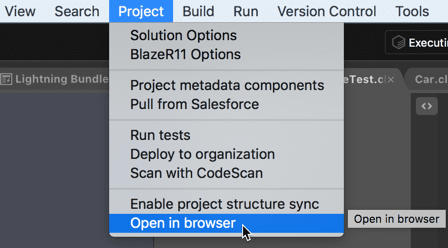
In the previous versions of The Welkin Suite Blaze, you already had an ability to open some your project's components directly on Salesforce (like Visualforce pages, Lightning Components and Applications, Layouts files), and beginning from the current version, you can open your whole organization in your browser in two clicks. This command is implemented to the context menu of your project in the Solution Explorer, and also you can find it in the Project menu in the main menu of the IDE.
However, this is not all The next small improvement in Blaze R11 is that now there is no necessity to type your org credentials each time when you go to some of these elements on Salesforce - you are already logged to your org in the IDE in your project, so no additional logins - TWS will do this itself and you can save several more seconds and clicks.
Talking about fixes in The Welkin Suite Blaze R11, in a frame of the work on the declarative development functionality, our developers have solved two issues when some items were missed in the Admin panel and these were:
- Validations Rules that included a MasterDetail field - they were absent in a list of rules when you expanded your object;
- Custom objects that had a namespace prefix - the IDE didn't detect them properly and this is why didn't load them from an organization to the Admin Panel.
So now you have even more accurate information in the Admin Panel and more abilities for your declarative development when using the sObject Inspector.
While we are working on improving the existing code assistance functionality, and extending its abilities to help you in a development process even more (soon you will get great updates on this), we have some cute and useful changes already now.
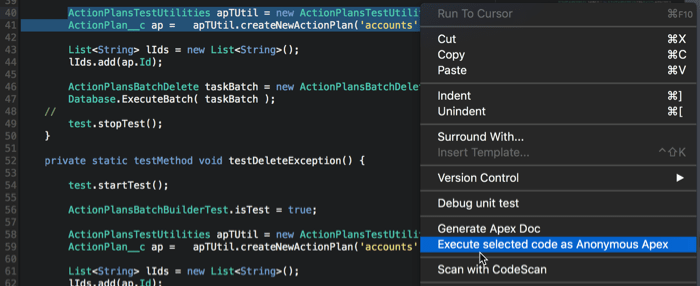
When you develop or change your Apex files, or there appeared some necessity to check some part of your code quickly, now you can run Anonymous Apex directly from an Apex file: select the code in the editor, right-click on it, and find a new command 'Execute selected code as Anonymous Apex'. No new files creation, no additional typing or copy/paste - several clicks and you will get an execution log file with all the results.
Also, we have fixed the issue when an empty inner class, had an incorrect status in the class outline list, and when it was absent from code completion suggestions when you coded.
In the Blaze R10 version of The Welkin Suite for Mac, there were cases when TWS crashed or hanged with an endless beachball when working on Code Coverage. Our developers investigated the possible reasons, and have handled some exceptions that could have caused these issues. Please let us know if you would be faced with such behavior again, or if the changes that were made have covered all the cases, and now you are able to proceed to track the coverage of your code by unit tests without any issues.
Also, as for the handled exceptions, we have covered an additional error from Salesforce when you built your changes, and they cannot be applied to an organization due to a temporary lock of organization's administration setup. Previously you could get a message that a file was modified outside the IDE, and now the IDE will show the actual reason for this case.
Have you been faced with other issues or do you have any questions? We always are happy to answer them and assist you - just contact us or send us a bug report directly from The Welkin Suite IDE.
Full list of changes
Features:
- Implemented the support for Copado for release management
- Implemented the integration with CodeScan for code analysis
- Implemented an ability to track changes in TWS project
- Added an ability to clone fields in a frame of one or several Objects
- Added the ApexDoc support for Salesforce DX projects
- Implemented an In-App Purchase
Improvements:
- Implemented the formula editor for fields that have a formula type in the SObject Fields inspector
- Added an option to open an Organization in a browser from the context menu of a project in the Solution Explorer or from the Project menu
- Updated 'Open in browser' commands to use the 'frontdoor.jsp' from Salesforce
- Implemented an ability to execute selected apex code from a class as Anonymous Apex
- Improved performance of FLS tab running it on Native UI
- Improved performance of Local History Detail pad running it on Native UI
- Updated The Welkin Suite IDE to support Salesforce API v.42
- Implemented a prefilling of API name for a sObject during its creation by default
Fixes:
- Fixed cases of the crash of TWS when using the 'Show coloring' command in the Code Coverage panel
- Fixed hanging of TWS when refreshing the Code Coverage data
- Fixed the issue when a Validation Rules that contained a MasterDetail Field was absent in the Admin panel
- Fixed the issue when a custom object that had a namespace prefix was absent in the Admin Panel
- Handle a temporary lock of an organization's administration setup during a build
- Fixed the issue when an empty inner class was absent in the list of code completion suggestions and it had an improper state in the code outline
- Fixed rare cases of TWS crash during retrieving test result when the connection with an organization was failed

Your comment may be the first