In the article “Salesforce Governor Limits: Is There a Way Past These Development Issues?” I suggested a few ways to solve to a problem with exceeding Governor Limits. Today I’d like to introduce another solution to the same issue, which, in my opinion, is far more efficient than the ones I already discussed. I’d like to talk about The Welkin Suite’s Apex Profiler.

The Welkin Suite’s Apex Profiler is a new feature that was first introduced in the version 0.29. Upon adding it, we are bringing the first stage of creating the tools for debugging the Salesforce apps to a head. This stage included:
- Retrospective Debugger
- Log Viewer
- Unit Tests Manager
- SOQL Query and Anonymous Apex Runner
- Apex Profiler
With the help of these tools, each developer, who uses The Welkin Suite IDE, can debug their applications in the most efficient manner. In some cases, it is even possible to do so without the immediate access to the Org, on which the problems appear. In the future, we are planning to improve these tools (namely, to extend the functionality and make them more convenient and user-friendly), as well as to add new ones for the extended coverage. Nonetheless, today I’d like to focus on the Apex Profiler.
First off, let’s take a look at the way Apex Profiler works in The Welkin Suite. You can start profiling any unit test in two ways when your caret is placed within the unit test:
- Main Menu -> Profiler -> Profile using Unit Test
- context menu in the editor -> Start profiling

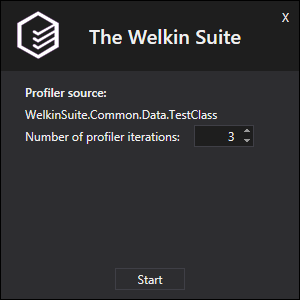
Please pay attention to the option ‘Number of profile iterations’. You can enter any number between 1 and 100 in this field. This parameter is highly important, especially for profiling Salesforce applications. As we all know, Salesforce response time may vary from one launch to another. Hence, to get a representational result, it is best to use the statistics received from multiple calls.
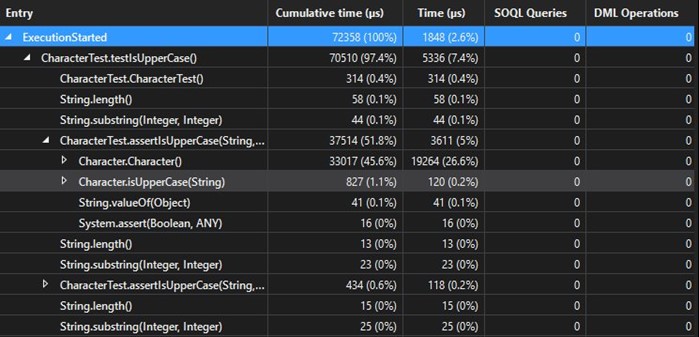
Upon launching, The Welkin Suite’s Profiler shows the statistics in the following window:

- Entry — the code Units / Methods name
- Time (ms) — time in milliseconds spent on the item's execution itself (without child nodes) and its percentage relatively to the all execution time
- Cumulative time (ms) — time in milliseconds spent on the method's execution (including all child nodes) and its percentage relatively to the all execution time
- SOQL Queries — the number of SOQL Queries performed in the item itself (without child nodes)
- DML Operations — the number of DML operations performed in the item itself (without child nodes).
Naturally, this is but the first version of the first version of the Profiler, and we will keep extending its functionality in the versions to come. In the near future, we are planning to implement the following possibilities:
- An option to add various ways of presenting the data. For instance, showing the detailed Call Stack, so that you could see where exactly in your code a certain method is executed more slowly, or uses more calls. Also, we are planning to show the space used for profiling (hip size). This way of presenting the data will be most convenient for Visualforce developers. It often happens so that to improve the user experience, you need to ‘drag along’ the large lists of data. As cool as it is, it may have a negative impact on the Governor Limits on hip.
- The percentage of Governor Limits usage by queries and operations.
- An option to navigate to the necessary part in the code from the Profiler.
- In one of the ways of presenting data, a ‘Hit count’ column will be added.
- And many more cool things to come =)
And yet, even this version of the Profiler, which is pretty basic so far, will let you solve the important everyday issues. Let’s take a look at the most common use cases, in which The Welkin Suite’s Apex Profiler will come in handy:
- A client asked you to make small changes to the org, and naturally, they were made quickly and in a good manner. And suddenly - the jig is over! An application fails to work as the Governor Limits are exceeded. Sound familiar? I bet it does. You may have faced this problem as many times as we did - and probably reached the same degree of frustration. In reality, though, all you have to do is launch the Apex Profiler and check, which method triggers the problem. After that, it’s all very simple. We open the method and make the necessary changes. If you believe this solution is still a bit complex, you can use The Welkin Suite’s Retrospective Debugger - it will make this process a piece of cake =)
- The second case is more of a precaution. After a few cases similar to that I described above, our Salesforce developers asked us to create a tool that would allow to run the code before uploading it. More specifically, an instrument which would let them run the tests, while also checking the productivity and Governor Limits. Will everything work correctly? Will it go without any pitfalls on the Production org?
- The third case can be called ‘getting ready for refactoring’. This case will be most acute when developing Visualforce controllers, or batch jobs. Particularly, in the cases when, after developing the business logic, you need to have a Profiler run to understand what exactly happens to the limits in reality. It often happens so that you have to re-build the architecture of the application, but it is always best to do so when developing it, rather than having to deal with the problems on Production.
However, let’s not forget that in order to use the Profiler with maximum efficiency, you need to have the adequate test data (both in size and character). It is best not to cut back on this. I fully understand that most commonly, you have very little desire to handle the boring task of getting the data ready. But that’s for now. We are aware of this issue, and we will soon start working on the full-fledged data generator and mockups. So far, we’ve introduced the Data Loader in the version 0.29, so that you could upload the data you prepared directly from your main tool.
Check these features out and let us know what you think! We are always open to suggestions, and your opinion fuels the improvement of The Welkin Suite.


Your comment may be the first