Troubleshooting and Debugging Salesforce orgs in The Welkin Suite
Even though Salesforce has always been an innovative platform, just a couple years ago our troubleshooting options seemed as they were much more closer to the stone age, especially when we were comparing them to the other development platforms like Java or .NET. We were using things like "System.debug()" to print out important information to the log files, and then we were analyzing hundreds and thousands of lines of logs (I can feel the migraines and the sandpaper eyes just thinking about this now). However since that time, we already have had a great amount of tools for debugging become available to us - you can see a short overview of some of them below, and even further below, we'll highlight a couple of common scenarios that we are normally faced with, and how to handle them with these tools ![]()


Salesforce Debugging Tools
Apex Retrospective Debugger
The Welkin Suite's Retrospective Debugger is a great next step of debugging in Salesforce - it allows you to go through your execution flow step-by-step, while monitoring changes in local variables and governor limits.
The Retrospective Debugger works with the Debug Logs set at certain log levels (mostly Fine or Finest), then it analyzes them, and rebuilds the execution flow, which in turn, provides you with the means to trace the code execution, and spot incorrect decisions in the code. Because it is working with debug logs, you have 3 different ways to start the debugger from the IDE itself:
- Running a unit test
- Executing some anonymous apex code
- Directly feeding a log file with needed log levels set
Unlike Salesforce's interactive debugger, which is from now on included into the Salesforce's Ultimate subscription, our Retrospective debugger doesn't require any additional licenses or payments from your side, and it can be used with any Salesforce org - this should be handy for consulting companies, or for those who are working on multiple different projects at a time.
You can find more information about all the capabilities of the Retrospective Debugger, and information how to use it in our documentation - for Mac or for Windows.
Apex Profiler
Salesforce's Governor Limits are at the same time, a huge pain in a developer's life, and a fun challenge that we always need to be thinking about, so we are ready to resolve any issues related to exceeding these limits. While the IDE can't write ideal code for you and it can't enforce you to use the best practices in terms of performance - The Welkin Suite IDE can and will help you to precisely track the governor limits "consumption", as well as it can help to identify the bottlenecks in the code you are working with. Having this information will significantly reduce the amount of time that is needed to resolve any issues, and it will also help you to focus your efforts in the right direction, in cases of refactoring or optimizations.
Our built-in profiler uses Salesforce's debug logs in the same way as the Apex Retrospective Debugger, and it doesn't require any special preparations from your side to work with it. You just simply profile your unit test that calls your business logic. Of course, we can't promise that the data that is extracted from the log files is 100% accurate (as writing the logs requires some additional CPU time), however by having an option to execute your code multiple times, you can be sure that the information you get is as close to the truth as possible!
Being able to view some additional information about the Governor Limits usage is also available in the Apex Retrospective Debugger - you can see this on the video for the Retrospective Debugger above, or in our documentation (Windows only).
More details about the usage of the Apex Profiler in our documentation (Mac / Windows) or in the video below:
Debug Logs
While Debug Logs are the most basic option for troubleshooting - they are still absolutely required and, sometimes, are even much faster that anything else. Especially if we have a good way to read and analyze them, such as with color highlighting, advanced filtering options, and tree-like hierarchy views of the debug log file. When you know what you are looking for - it's a very fast and easy thing to do in The Welkin Suite.
In our documentation, you can find some more details about the Debug Logs viewer (Mac / Windows) and panel (Mac / Windows).
And more...
There is even more handy features and tools that are built-in The Welkin Suite IDE that might help you with troubleshooting issues, just to name a few:
- SOQL Query Builder and Executor - allows to quickly retrieve all the needed information from the org. Read more for Windows or Mac.
- Anonymous Apex with an ability to create and store multiple separate Anonymous Apex "snippets" as a part of your project - allows you to trigger logic on the org when needed, or insert, delete or modify records, and do a lot of other things. Read more for Windows or Mac.
Salesforce Org Troubleshooting Scenarios
Fixing Apex Unit Tests
It's not a secret that unit tests are very efficient in ensuring that your code is working properly (ok, at least on the "unit" level, but anyway), and a thanks to Salesforce for enforcing that everyone is writing them. But a sad fact of reality is that if your unit tests are really testing something (and not just increasing code coverage numbers) they will fail, sooner or later, especially if you're actively developing some new functionality, or modifying an existing one. In many cases we're almost immediately able to understand the reasons for the failure, and we can pretty simply identify the best way to make the unit tests green again. However, it's not a rare situation when we can't clearly say why a unit test has suddenly started to fail, and where exactly in the code (or in a configured automations) we need to fix it. Taking into account amount of unit tests which are developed by every single Salesforce developer, we believe that this case is familiar to everyone, and all of us know how painful, and slow debugging can be. Let's see how such a situation can be handled in The Welkin Suite with a very simple example.
Troubleshooting Production Issues
In real life, production issues are much less common, when comparing them to something else, such as failing unit tests or issues on the "developer-controlled" environments, like Salesforce sandboxes or Development orgs. However they do seem to cause much more stress, and each and every second, usually, counts. Especially, if this is happening at night and you, as a developer, need to leave your bed until you have fixed the issue ![]()
How does the process of identifying the root cause of some likely issue usually look?
- Usually the End-users are not able to provide much information about the data they were working on, or the related objects/processes that were running at the same time - just because they are not aware of how things are built under the hood.
- If we have access to the production environment and data - we are confirming everything about the steps a user has done, in order to try to reproduce the same behavior on the same record (because we still can't model similar environment, as we don't understand the reasons). This usually takes some time, as the users do not always write down every action they take when they are just working

- If we don't have access to the production environment, and data, which we are starting to communicate with the end-user, is very tight to get all the information that we might need to TRY to model the same situation on the sandbox. This can result in a couple iterations, but we might be finally getting to the point where we can reproduce the issue on the sandbox
These "very simple" steps are usually very time-consuming and stressful, but we can't do the easiest thing - ask a user to send the log file. Why?
- If we'll set (or ask user/admin on the org) debug levels to debug/info - we won't be able to get much information, unless we have lots of system.debug calls on production (hope, not).
- If we'll set (or ask user/admin on the org) debug levels to finer/finest to be able to reconstruct the whole execution flow, and all steps done by user - we'll spend hours reading that log file with at least 5-7k lines of entries (and it'll be very painful for your eyes, especially at night)
However, the Retrospective Debugger takes all the pain out of reading and analyzing the log file, and reconstructing the execution flow - this is why you can easily now ask your user to send you a log file with the proper debug levels (or do it yourself, if you have access to the org), then in the project with your Sandbox (or Production, if you have access to it), you can start simply start the Debugger from the log file.
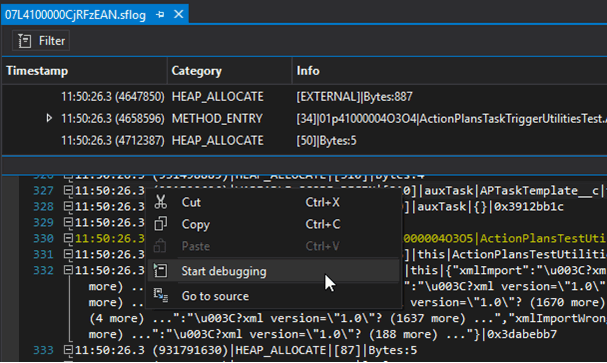
Once you do this just once - you know the power of the Debugger, so finding the broken code will be hours closer to you!
Dealing with Governor Limits
There are 2 main cases related to the Governor Limits where the IDE can be of great help:
- Refactoring or optimizing the existing codebase to perform better, and to avoid hitting the limits
- When you've already hit the limits, and need to resolve the situation as soon as possible
In both these cases, The Welkin Suite won't be able to optimize the code for you, however it will save you a lot of time while searching for the code that needs some special attention and care.
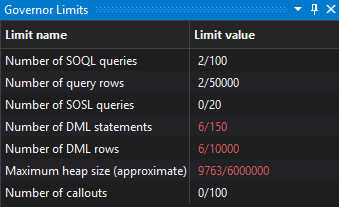
In cases where it is absolutely unclear where the bottleneck is, you can just start right away with the Retrospective debugger - you can even ask for a log file from your end-users after they've reproduced this issue (exactly like in the previous scenario). Once you have a log file to work with, you can start the debugger, enable the Governor Limits panel, and spend just a couple of minutes going through the execution flow and monitoring the changes in the Governor Limits panel (btw, if a value in the panel is changed as a result of the last step - it will be highlighted in color so it is even easier to see). You can even set breakpoints in potential bottleneck areas, for future reference - this is very helpful when you'll be going back to optimize the code or going back to resolve the issue.
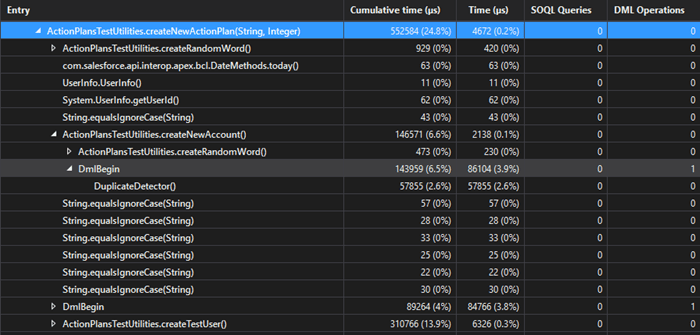
When you have identified the exact places in the code that should be under suspicion - a good option would be to write a simple unit test method, which will call that logic (as deep and close to it as possible). Why is this good option? Because you'll be able to start the Apex Profiler for this unit test using a couple iterations (3-5 is usually enough) in order to gain a detailed breakdown of CPU time, SOQL queries, and DML operations usage. In the Profiler's report you'll get the overall "weight" of each method and call, in consumption of limits, so you'll definitely know what to optimize first, so your time will be spent in the most efficient manner.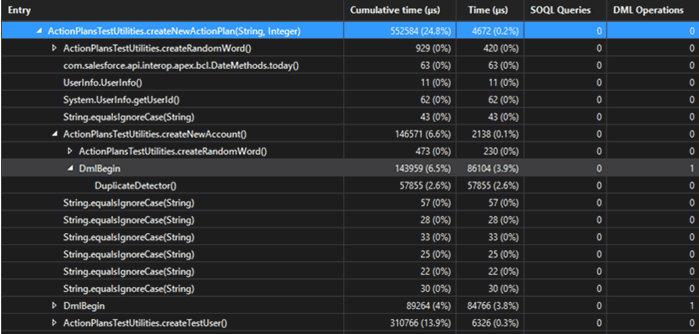
After you finish with your refactoring, you can run the Profiler for the whole block of logic that you've changed, just to confirm that everything is good, and you're far away from hitting Governor Limits!


Your comment may be the first