


Release of Apex Retrospective Debugger in The Welkin Suite 0.27.5
We catch our breath and introduce you the most expected feature of the last several months. Please meet The Welkin Suite’s Apex Retrospective Debugger!
Beginning from the 0.27.5 version of the IDE you have the ability efficiently analyze your code, watching step by step the executing of all the operations and calls.
The Apex Retrospective Debugger helps you to understand how your code works in reality, especially when you need it to be done fast. It uses the information from the Salesforce Debug Logs, so you can easily reproduce the execution of your code and which lines of code were executed, trace all actions, view the state of the entire call stack, all methods and constructors calls, initialization and value assignment to variables, including objects with lists, etc.
You can use as a source for the debug information any unit test from your org as well as a log file. The minimal required level of the logs for the ability to work in Debugger mode is the next:
- Apex Code — Finest,
- System — Finest,
- Database — Info,
- Apex Profiling — Error,
- Callout — Error,
- Validation — Error,
- VisualForce — Error,
- Workflow — Error.
You can easily change the log levels. To do this, log in to your org, and follow the next way:Developer Console -> Debug -> Change Log Levels -> Add / Change. Please note, when you start the debugging process, The Welkin Suite will automatically change the log levels (and roll back the setting after the polling of logs is finished).
Launch the debugging process for...
- Any Unit Test: you should open the file with a unit test in the editor. You can use the right-click on the test and select the Debug unit test item in the context menu. Another way to open the Debug mode, you can use the Main Menu -> Debug -> Debug unit test. When you start the debugging, this test will run first, and after it is finished, the Debug mode will open.
- Any existing Debug Log file: go to the Main Menu -> Debug -> Start debugging from a log file. In the Logs folder in your project you have files, which were downloaded from Salesforce if you have downloaded them (Main Menu -> View -> Logs Window -> Download Logs). Just open a necessary log file in the Debugging mode in the IDE and look through all important information. This option gives you almost unlimited possibilities: you are able to run the Debugger even if you have a Production org, having only the logs and the current version of the code.
Debug Mode
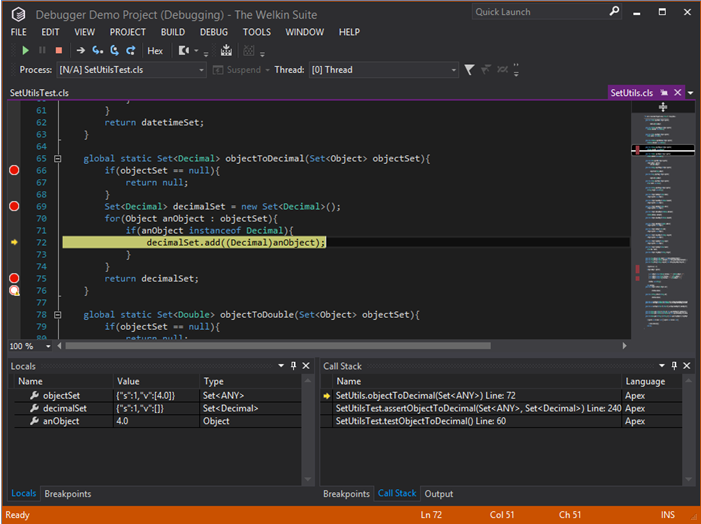
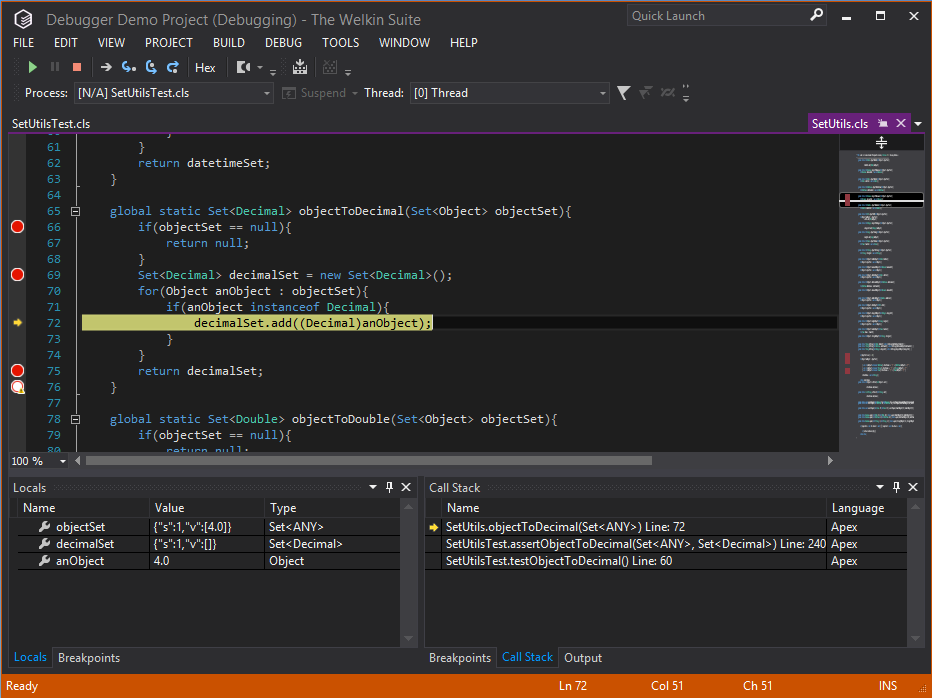
When you start the debugging process, The Welkin Suite turns to the Debug mode. Here you can get access to all necessary functions and information:
- an editor window with the code,
- an ability to set breakpoints and manage them,
- navigation through the code using steps,
- a list of locals in an active part of the code,
- an ability to trace the way of the execution in a call stack.
Navigation in the Debug mode
At the beginning of the debugging process, the Debugger's caret is placed on the first line of the execution flow. Using the navigation panel, you can Continue or Stop Debugging (Shift+F5). In the first case, if there are no breakpoints, the Debugger executes the log till the end and closes. Also, if you click on the Stop button, the debugger will close.
The navigation with steps allows you to manage the debugging more flexible. Here are such options available:
- Show the next statement — this option shows the next statement that will be executed. It is especially helpful when you explore the call stack and lost, where the process is now,
- Step into (or the hotkey F11) — if a method calls another method, use this option to move into this method,
- Step out (or the hotkey Shift+F11) — it allows to move out of the method that was called by another method and go on a higher level,
- Step over (or the hotkey F10) — use this option to execute step as a unit, without stepping in other methods if there is such step.
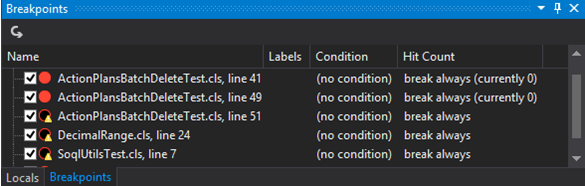
Breakpoints
With using the breakpoints you can greatly reduce the debug time. Set the breakpoint next to the step that you want to explore in details, and the Debugger will stop the execution at this point. You have an ability to set the breakpoints before the debugging as well as when you are already running the debugging. All the available breakpoints are marked in the red color if the breakpoint isn't available from the current position, its color is white. In the addition, you can find the list of all the breakpoints in the Breakpoints panel, which is placed on docks with the Locals panel at the left bottom corner of the Debugger window, and with the Call stack at the right bottom corner. You can use this panels for navigation through the code — just double-click on the breakpoint, and the editor will be focused on the line with this breakpoint.
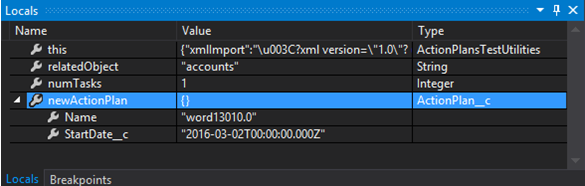
Locals
When you’re going through the execution context, you are able to see all the locals in this part of code. In the Locals panel, you can find all the variables, their names, types and values. This helps you to trace each change of the variable's value or other attributes on every step of the execution process, so you can determine, for instance, what causes the error or the fail. With all the variables and all the data about them, you are able to understand the work of your code in deep details.
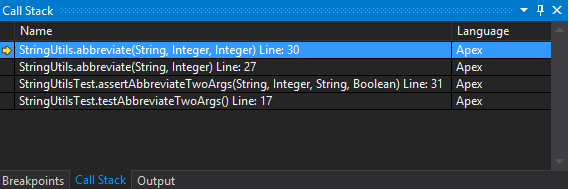
Call stack
Moving through the debugging process often leads you to other test methods or files, so you have a way with a complicated nesting level. To find where you are now and what was your path, for instance, what operation called the current test, you can use the Call stack panel at the right bottom corner of the Debugger window. Here you can see all the strings in the descending order — this means that your current position is at the top of this list, and their language. You can navigate with the double-click on any item; this allows you to make clear what caused the moving at a deeper level. When you move at a higher level (using the Step out option), the call stack removes the deeper levels from the list.
Known limitations
The Welkin Suite's Apex Retrospective Debugger give you all necessary tools for observing the behaviour of your code and its issues. However, there are some limitations at the moment:
- the variables can have cut text in their names or descriptions because of Salesforce limits,
- the list of local variables includes only user's locals,
- the private variable in a cycle is not available outside the cycle in the code, but it is still visible in the Locals panel until the end of a method,
- the code from the managed packages, workflows, process builder processes, validations is skipped,
- the code from getters and setters is skipped,
- properties values are not shown in the Locals panel (however fields are shown).
As a side note, we want to admit that sometimes Salesforce documentation is not excellent in terms of logs, so your feedbacks with all the information about incorrect Debugger behaviour will be appreciated. You can write us if you encounter any strange behaviour.
External Tools Support
In this version, our team has released one more important feature — support for external tools. Now you are able to easily add the third party tools that you use to The Welkin Suite’s menu, for example:
- different Ant tasks,
- minimizers or beautifiers for Javascript / CSS files,
- your own custom tools and scripts.
This option allows you to work with your favorite application for development in a single IDE. You can forget about switching between different windows, all you need now is available from the Main Menu of The Welkin Suite.
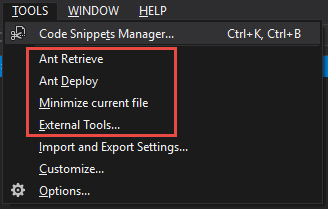
To begin the work with the External Tools you should open the Main Menu -> Tools -> External Tools. The window that you will see allows you to add the new one or to manage your present external tools.
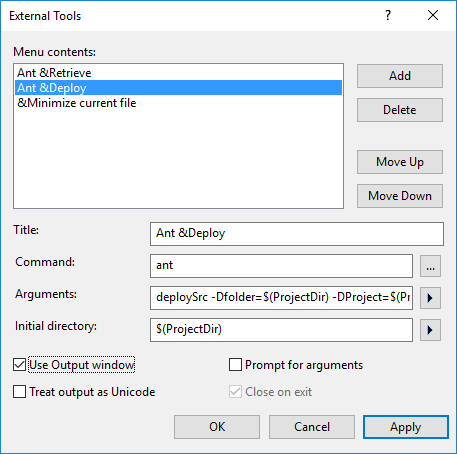
You need to fill only several fields:
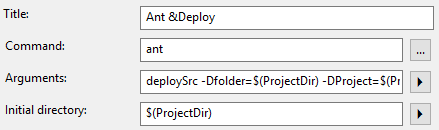
- Title — the custom name of your tool,
- Command — the execution operation of you tool; this can be an exe, application, bat or powershell script, etc.,
- Arguments — this section allows to specify a necessary information for your tool; it can be a file, project, solution, some text, position of your cursor in the code, etc.,
- Initial directory — the folder where your tool is located.
On of the additional abilities for your external tool is to use Output window. If you mark the appropriate chek-box, the messages from your tool are displayed in the TWS Output panel.
Custom hotkeys for external tools
In addition, you have an ability to set your custom hotkey for a favourite tool, using the standard Windows behaviour. In the Settings window for the tool put & + the letter for calling this tool. As a result, you will be able to call the tool by using the Alt+T, [letter] hotkey. For example, the Alt+T,D hotkey opens the Tools menu, and then, for our case, the Ant Deploy tool.
In addition, thanks to the support for the external tools you can pass different information about the project or current file to the external tools as arguments.
Other changes
Except the work on the Apex Retrospective Debugger, we added to the release of 0.27.5 version of TWS several fixes.
Our team has fixed the issue related to the crash of the IDE during the work with commit details in the Commit details view. This issue was actual during the work with a Git Repository.
Also, there were several cases with the exceptions when you opened a project with an opened Debug Log file in it. These issues are fixed in the newly released version of the IDE.
The little UI correction is done in the Local History details panel — we have fixed the name of the 'Status' column.
In addition, the ability to move a folder with files inside it is disabled. Earlier this led to the required pull and incorrect behaviour.
Future plans
The great work on the Apex Retrospective Debugger isn't finished. Our team is going to improve it. So we kindly ask you to share with us your stories, ideas for improvements and all the bug reports regarding the Debugger.
The next steps in our plan are the implementing of new Debug Logs viewer and Salesforce Migration Tools.
At the same time, this spring will be dedicated to the Apex Code Completion enhancements.
The further development of The Welkin Suite's Apex Retrospective Debugger and the mentioned features depends on your feedback! Feel free to contact us on socials (Facebook, Twitter, Google+,LinkedIn) with any ideas, or suggestions, or bugreports. You can influent on the developing of The Welkin Suite.
Full list of changes
New Features
- Added an ability to start Apex Retrospective Debugging from any unit test
- Added an ability to start Apex Retrospective Debugging from an existing Debug Log file
- Added support for an External Tools in the main menu
Fixes
- Fixed crash when opening commit details in the Commit Details view
- Fixed rare exceptions when opening a project with an opened Debug Log file in it
- Fixed incorrect name of the column in the Local History Details panel
- Disabled the ability to move a folder with files inside in the Solution Explorer

Your comment may be the first