As much as we would like to deny this, errors and bugs are integral to the development of any program. Most developers spend endless hours debugging their code, trying to bring it to perfection. To reduce the time spent on bugfixes, a series of intricate development procedures are used, along with automated testing systems and quality assurance processes. And yet, each day customers keep reporting new problems with the software they are using. And it is unlikely you will avoid these problems--even if you are implementing automated tests, you still need to debug them quite often.

Naturally, modern development tools help developers a great lot. They incorporate operator and method tooltips, syntax highlighting, semantic analyzers and much more. Developers resort to unit tests to check code performance, or make use of automated tests at the UI level, and yet bugs still somehow make their way to the final product version. This is especially acute for Salesforce development, in which the interaction with the unique system components (such as workflow and validation) or components that are more prominent in Salesforce than other types of development (triggers, etc.) cause errors to appear more often.
Also, there is always a chance that something completely unforeseen happens in the place you least expect it to happen--for instance, in the method you created a year ago, and which was working flawlessly this whole time. And then, at some point, the external web service starts returning unexpected values, or undocumented values appear in the database, or something equally unthought of and frustrating happens. Either way, such problems are extremely unlikely to be found using simple code analysis.
Besides, your customer doesn’t really care if your code is beautiful and clean, and that it SHOULD work correctly. The only thing that matters to them is that it DOESN’T work--and your client expects you to find a solution. Here’s where a debugger comes in handy, since you need to understand how your code works IN REALITY, and you need it done fast. And there is no other way you can do this without using a debugger--after all, you don’t write your code without your computer screen, right?
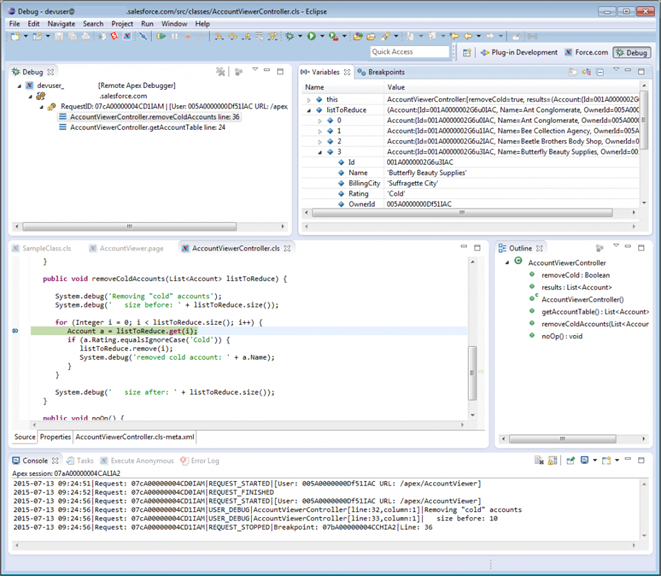
Salesforce has introduced a brilliant online debugger, which is capable of solving this problem -http://docs.releasenotes.salesforce.com/en-us/winter16/release-notes/rn_debugging_debugger.htm

And yet there are always a few details you cannot help but consider:
- Price. We all know how life is not a bed of roses. Sometimes, even if the solution is perfect for handling your issue, its high price may not allow you to use it.
- It may be impossible to debug your code in the org, on which the problem can be reproduced. I am quite sure you’ve come across the situation, when the problem is only reproduced at the customer’s side. And (Murphy’s law comes into play), they just happen to be your most important customer. Or most picky. Or--killer combo--both.
This is when we start looking for a way out, suddenly remember about log files and dive into analyzing their content.
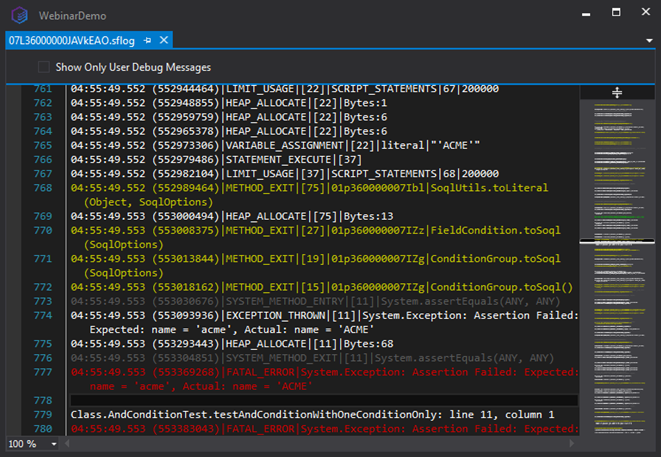
Chances are, a few minutes later you will be surprised at how cool Salesforce instantly gets. Without extra exaggeration, their logs and log tools are amazing! They contain all the information you may need about the process, all method calls, executable lines, variable values, validations, workflows, visual flows, process builder flows, assignment rules, triggers, etc.(https://developer.salesforce.com/docs/atlas.en-us.198.0.apexcode.meta/apexcode/apex_debugging_system_log_console.htm)

My colleague, Vladimir Gubanovich, got so impressed by Salesforce logs that he is now frantically preparing a series of articles dedicated to the topic. But let’s go back to our issue. If you are not allowed to run a debugger (on a production org, for instance), you still have a log file with every little detail you may need. And here’s where the advantage may transform into a giant drawback within seconds. The log is very detailed, meaning that it is very large. Did I say large? It’s HUGE! On the maximum log detalization level, the file size for 4 primitive unit tests will exceed 2000 lines. 2000 lines, Carl! Can you imagine yourself reading this in a text file, and trying to process it afterwards?

This is what one of our developers looked like when he saw a 2Mb log file (to get things clear - it had over 20.000 lines it). He knew the answer is definitely in there somewhere, but even the thought about looking for it in the file this large brought the depicted grimace onto his face. That is when we came up with the idea of creating a new tool for The Welkin Suite--The Welkin Retrospective Debugger. The main idea of this tool was to provide the developers with the debugger interface when working with log files. You won’t have to restart the debugger, you can simply navigate back and forth to view the state of the entire call stack, variable values, etc. However, let’s not focus on this right now--this topic requires a separate discussion.
Meanwhile, I am interested in your own experience and feedback on the way you prefer: debugging via a debugger, or reading logs? Shall we discuss it?


Your comment may be the first