


Managing static resources and analyzing code coverage in the Bloom R10
While you are exploring new abilities of Salesforce DX, we have prepared for you a new version of The Welkin Suite IDE for Windows with useful updates for your regular Salesforce development. This time we want to provide you with new features for well-known and always in-trend functionality like managing Static Resources, getting more detailed information about Code Coverage for your Organization, and other ones - just keep reading 

Static Resources Management
Today we are releasing one of the highly-awaited features - static resources management directly in the IDE. What does this mean? How does this work? Let's see in details!
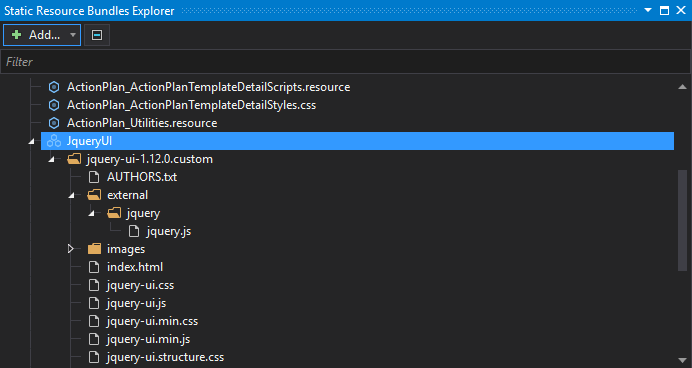
Starting from the Bloom R10 version of TWS you can find and enable the new panel 'Static Resource Bundles Explorer' from the 'Main Menu → View'. In the panel that will appear, you will see the list of all static resources from your project(s) and all of the included items for zipped ones.
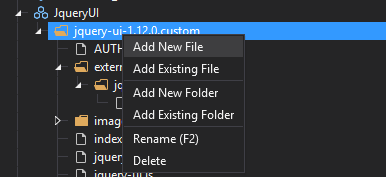
Of course, you can open any file in the editor with a simple double-click, but when you right click on any zipped static resource or folder you will get an ability to use the additional options like:
- 'Add New File' - creates a new empty file in the given static resource or folder, so you can modify it later;
- 'Add Existing File' - allows you to select any existing file from your file system to include it into the static resource (or to put it into the selected folder);
- 'Add New Folder' - creates a new empty folder in the selected static resource/folder;
- 'Add Existing Folder' - provides you with an option to select an existing folder on your file system to include it (and all files and folders in it) into the Static Resource;
- 'Rename (F2)' - quick and easy way to rename a file or folder; we want to draw your attention that it is not available for Static Resources;
- 'Delete' - removes a file or folder from a Static Resource or a Static Resource itself from the organization.
Additionally, you have an option to 'Open in browser' that is available in the context menu for any Static Resource - this will redirect you to the appropriate Static Resource edit page in your Organization.
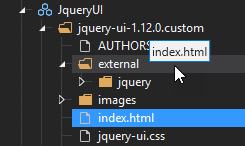
You might have a question on how to rearrange existing files and folders in your Static Resources because drag&dropping them in the 'Solution Explorer' won't change anything in the Static Resource structure. As you might guess - you can do this in the 'Static Resource Bundles Explorer' panel - simply drag & drop files and folders inside the Static Resource to get the needed structure!
Please note that when you will do any changes on the structure of a Static Resource and content would be first reflected in the %project_folder%\resource-bundles\%static_resource_name% folder, while changes in the related zip file itself will be available after performing a build. At the same time, these changes won't be reflected in the Solution Explorer (so, if you're using project structure sync - it won't be updated as well) unless you build your changes.
Also, we should note that if you would move any files that are included in your Static Resource in the Solution Explorer (thus customized the project structure) and then you would change the structure of this Static Resource - the IDE won't change the location of that files in the project structure.
The last missing item here (no? let us know what's missing!) is the creation of Static Resources in your TWS project - now this is as simple as clicking on the 'Add' button in the panel's toolbar and selecting 'Add New Static Resource':
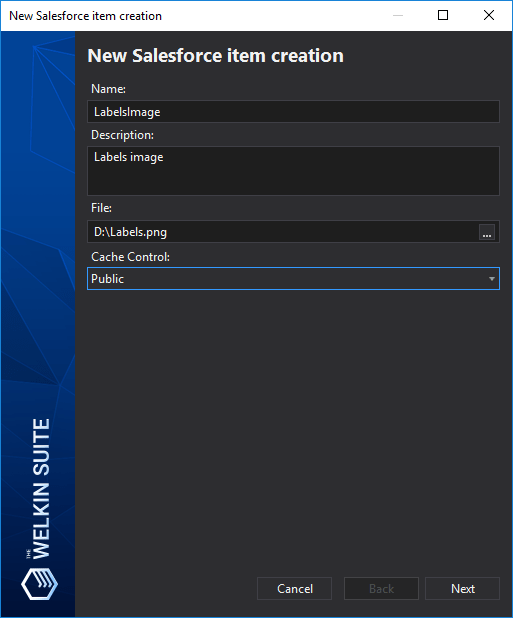
Once you do this you will be asked to enter a name of a static resource, its description, specify a file, and select a cache control option. When you press 'Next' the IDE will create a Static Resource on your Organization and download it, so it will be immediately available in both 'Solution Explorer' and 'Static Resource Bundles Explorer' panels.
Code Coverage Improvements
One of the most common and essential areas of The Welkin Suite IDE is unit testing and everything related to this. There were no updates in the code coverage functionality for a while, but in this release of the IDE we are rolling out 2 important updates, thanks to our users who've reminded us that there's still some room for improvements in this area!
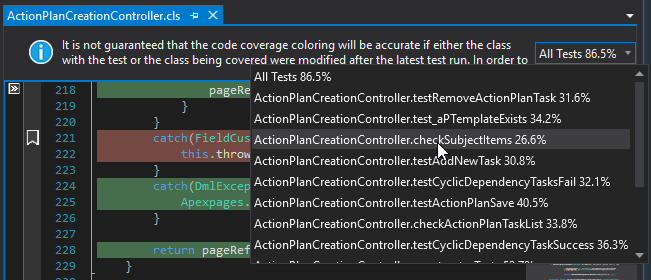
First of all, we have added an option to examine the code coverage for your classes and triggers by unit tests, like this is possible in the Developer Console (but with all other benefits of The Welkin Suite, of course  ). To do this you need to open the 'Code Coverage' panel from the 'Main Menu → View', enable the 'Show Coloring' option and open a class or trigger, that you'd like to examine. In the message bar, that is located in the upper part of the code editor you will see a dropdown with the list of unit tests that are covering code in this file. As well there you will find the information about code coverage percentage that is provided by each of the unit tests. If you need to see the code coverage coloring by unit test - just select the unit test in the dropdown and the editor will show you appropriate highlighting!
Another change is related to the information available in the 'Code Coverage' panel itself: previously the IDE was not showing you classes and triggers without code coverage data in the Organization. In general, this was ok, but this approach reduced the visibility of potential issues with the code coverage. Starting from the Bloom R10, The Welkin Suite will show you all classes and triggers from your Organization in the list, so if there is no code coverage information available you will be aware that you need to run tests that cover that apex or this is necessary to write such tests first .
Updating to the latest versions of the IDE even faster!
You might already know that we are releasing new versions of the IDE with new features, improvements, and fixes very often, and we believe that you'd like to get your hands on all the changes as soon as possible. We have an auto-updater functionality for this, however, we want to give you more possibilities for updating to latest versions faster. So today we are releasing 2 changes in this area:
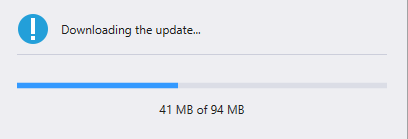
- Each time when you start the IDE it will check for available updates - if new version would be found, The Welkin Suite will download the update and it will ask you to apply this update when you are ready;
- New 'Check for updates' option located in the 'Main Menu → Help' checks if there are any updates for the IDE, downloads them if needed, and allows you to easily proceed updating the IDE.
We believe these two new options will help you to be among the first to try out new versions of The Welkin Suite!
Other changes
In addition to the newly added abilities in The Welkin Suite Bloom R10 that we have described above, we also have implemented several helpful options related to an existing functionality.
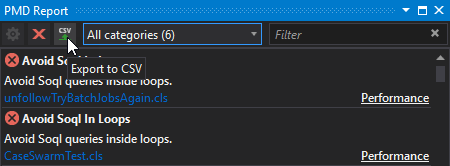
For example, now you can export results from your PMD report to CSV file. We have added an option for this in the toolbar of the PMD Report panel - all the data from the list will be stored in a file and you can use it outside of the IDE.
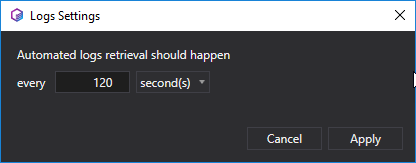
The next new setting in the IDE is the option to configure an interval for downloading your debug logs from a Salesforce Organization. It is available for you on the 'Logs' panel: when you enable the 'Download Logs' toggle-button, the IDE retrieves your log files each 20 seconds by default. Beginning from now, you can change this value, for example, to decrease the number of API calls to your organization from the IDE. When you click on a 'Log Settings' button you will get a pop-up window for configuring this interval:
Also, we have made several changes related to the Scheduled Jobs panel to make your work with this functionality is more convenient in the IDE. First, now you can use filters for easier navigation in the list of scheduled jobs from your organization. Second, if you prefer using cron expressions while setting up a schedule for starting a job, you can use all the necessary symbols, and '#' also which was not available in the previous version of the IDE. And third, we have solved the issue when your settings for automated updates of the list were rolled back after pressing the 'Refresh Jobs' button.
In TWS Bloom R10, our developers have worked on the performance issue that was caused by refreshing test results presented by icons which are available for you in the code editor. We found that this process was the reason for increased CPU and RAM usage and we have changed our implementation to avoid the issue.
One more of the fixed issues is related to TWS 'Admin Panel': when you expanded the sObject that contained Outbound Message as one of the actions in workflow rules, the IDE could be crashed. Now you can continue your working process without this bug.
The full list of changes in The Welkin Suite Bloom R10 is published below and you can find it on the Download page also.
Full list of changes
Features
- Added an ability to create Static Resources from the IDE
- Added an ability to modify the structure of Static Resources, and add or remove files and folders to them
- Implemented an ability to see the code coverage percentage and highlighting separately by test methods
- Added an ability to check for new versions and force update to the latest version directly from The Welkin Suite
Improvements
- Added an ability to export a list of results from the PMD Report
- Added an option for configuring the interval for refreshing debug logs
- Extended the list of files in the Code Coverage panel with all the classes and triggers from an organization
Fixes
- Removed a 'Watch' panel in the Debug mode since the functionality wasn't yet implemented
- Fixed the issue when the filters in the Scheduler Jobs panel didn't work
- Fixed the issue when there was no ability to create a Schedule job with a cron expression that included the # symbol
- Fixed the issue when using the 'Refresh Jobs' option disabled the automatic settings for refreshing scheduled jobs in the Scheduler Jobs panel
- Fixed rare cases of TWS crash when expanding in the Admin panel the sObject with the enabled actions type OutboundMessage
- Fixed the performance issues (increasing of CPU and RAM usage) caused by refreshing test results icons in the code editor
- Fixed the error 'File is used by another process' after merging conflicts by WinMerge tool during the pull process

Your comment may be the first