


What To Do If You Keep Exceeding Apex CPU Time Limit?

Are you hitting that wall of frustration with “Apex CPU time limit exceeded”?
If you get this error on your organisation, this most likely means that the logic in your organisation is not setup good enough to process large amounts of data, and that you need to optimize something somewhere. So Let’s get to work to fix this.

To get this started, first off, we need to stress here that not everything, in terms of transactions, is counted in the CPU limits. What Salesforce has counted here is:
- All Apex code (with all calls of Apex library functions too)
- Workflow execution
So, there are no Database Operations, Callouts, or SOSL counted here. Also, it is important to remember that in context, the limit of time is 10,000 milliseconds (10 seconds) and 60,000 milliseconds (60 seconds, in asynchronous Apex).
Now, that we have all this knowledge in mind, we can start to make our code better!
Here are some of the ways of how we can make it better. We can:
- use more optimized loops
- use bulkified triggers patterns
- move some logic to future methods
- avoid nested loops where it is possible
- move aggregation to SOQL where it’s possible
OK that all said, the next step is obvious and logical, we need to find out what part of our code is taking too long to execute. However, the biggest issue here, used to be the hard question of how to do this simply up-until now. So what we will do now is use The Welkin Suite Profiler to find the bottlenecks in our code, and then we can take the correct steps to optimize these areas like for instance, the following measures.
1. Optimize our Loops
Let’s ask ourselves a good question here, when writing code, do we take the time to think about what loops we should be using, and what is the true difference between them? Of course we all should be doing this, but to be honest, most of the time, if we are processing something small, it’s doesn't really seem to matter much, and so we become a bit complacent. However when large amounts of data are involved, for instance, one and a half thousand records, this can really have an influence on the execution time.
Let’s compare a few types of loops.
public static void testForEachLoop(){
	List<Vechile__c> accs = [SELECT Id, Name FROM Vechile__c LIMIT 5000];

	for(Vechile__c acc : accs){
		acc.Name += TEST_STR;
	}
}


public static void testForLoop(){
	List<Vechile__c> accs = [SELECT Id, Name FROM Vechile__c LIMIT 5000];

	for(Integer i = 0; i < accs.size(); ++i){
		accs[i].Name += TEST_STR;
	}
}


public static void testImprovedForLoop(){
	List<Vechile__c> accs = [SELECT Id, Name FROM Vechile__c LIMIT 5000];
	Integer size = accs.size();

	for(Integer i = 0; i < size; ++i){
		accs[i].Name += TEST_STR;
	}
}


public static void testWhileLoop(){
	List<Vechile__c> accs = [SELECT Id, Name FROM Vechile__c LIMIT 5000];
	Integer size = accs.size();
	Integer i = 0;

	while(i < size){
		accs[i].Name += TEST_STR; ++i;
	}
}
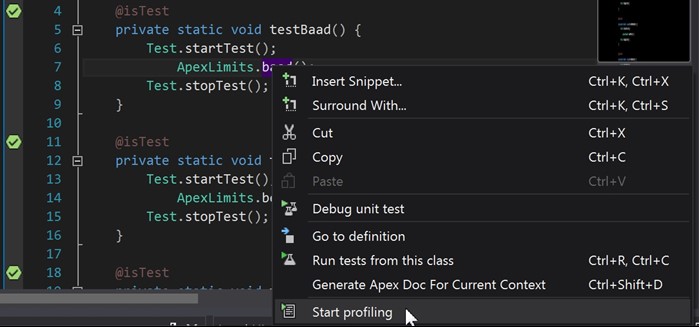
Now then, to run the profiling using The Welkin Suite, we will first need to write some unit tests for all of them:
@isTest
private class ApexLimitsTest {

	@isTest
	private static void testForEachLoop() {
        Test.startTest();
            ApexLimits.testForEachLoop();
        Test.stopTest();
	}

.
.
.
.
}
We can run the profiling this way:
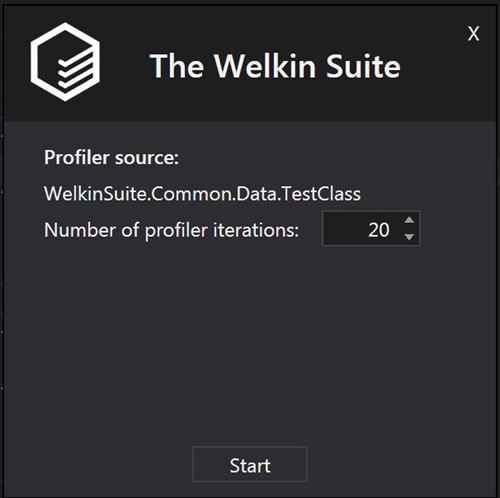
also we can set number of executions of test (to get more statistically correct results, set it to 10 or more times)
and get the results:
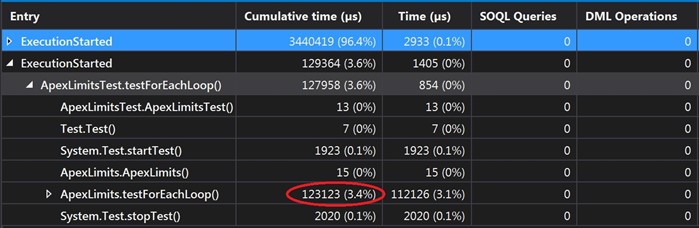
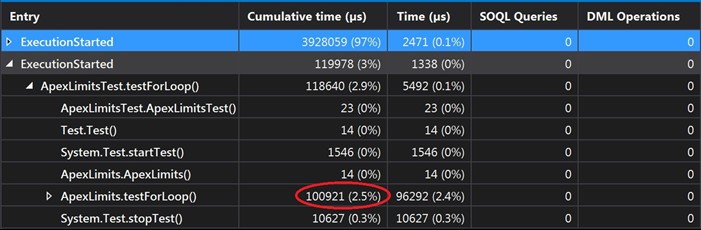
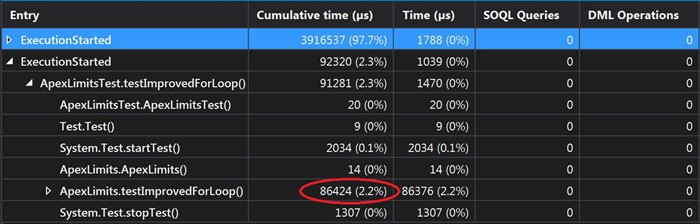
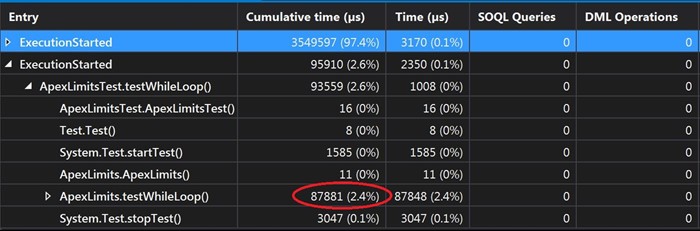
As you can see, form these results we can very easily see, that even though they are all using the same amounts of data, every loop has a different time of execution. So, for example we can see that for the ForEach and for the standard For, it takes almost the same amount of time to execute (100 - 120ms), but for the ImprovedFor and for the While (86ms), there is a 25-30% better performance. So, if you need to process large amounts of data, you can use this information in your favor to gain some better performance of your code.
2. Use Triggers patterns
It is always best to ensure that we use trigger patterns in our organisation, but we also need to ensure that they are being used in the most optimal way.
First of all, one of the best tactics for this is to have only one trigger per object. It might make it a bit more complicated, but it is also much easier to understand this way. Therefore a good practice for this, is to use a trigger handler pattern.
Here is a good and simple pattern for a trigger handler called ITrigger which is bulkified:
public abstract class TriggerHandler {

    protected Map<Id, SObject> oldMap {get; set;}
    protected Map<Id, SObject> newMap {get; set;}
    protected List<SObject> oldList {get; set;}
    protected List<SObject> newList {get; set;}

    public TriggerHandler(Map<Id, SObject> oldMap, Map<Id, SObject> newMap,
                            List<SObject> oldList, List<SObject> newList) {
        this.oldMap = oldMap;
        this.newMap = newMap;
        this.oldList = oldList;
        this.newList = newList;
    }

    public interface ITrigger {
        void bulkifiedBefore();
        void bulkifiedAfter();
        void beforeInsert(SObject so);
        void beforeUpdate(SObject oldSo, SObject so);
        void beforeDelete(SObject so);
        void afterInsert(SObject so);
        void afterUpdate(SObject oldSo, SObject so);
        void afterDelete(SObject so);
        void beforePostProcessing();
        void afterPostProcessing();
    }
}
Trigger:
trigger AccountTrigger on Account (after delete, after insert, after undelete,after update, before delete, before insert, before update) {

    TriggerHandler.ITrigger handler = new AccountTriggerHandler(Trigger.oldMap, Trigger.newMap, Trigger.old, Trigger.new);

    if (Trigger.isBefore){
        handler.bulkifiedBefore();
        if (Trigger.isDelete) {
            for (SObject so : Trigger.old){
                handler.beforeDelete(so);
            }
        } else if (Trigger.isInsert){
            for (SObject so : Trigger.new){
                handler.beforeInsert(so);
            }
        } else if (Trigger.isUpdate){
            for (SObject so : Trigger.old){
                handler.beforeUpdate(so, Trigger.newMap.get(so.Id));
            }
        }
        handler.beforePostProcessing();
    } else {
        handler.bulkifiedAfter();
        if (Trigger.isDelete){
            for (SObject so : Trigger.old){
                handler.afterDelete(so);
            }
        } else if (Trigger.isInsert) {
            for (SObject so : Trigger.new) {
                handler.afterInsert(so);
            }
        } else if (Trigger.isUpdate) {
            for (SObject so : Trigger.old) {
                handler.afterUpdate(so, Trigger.newMap.get(so.Id));
            }
        }
        handler.afterPostProcessing();
    }
}
And finally TriggerHandler
public with sharing class AccountTriggerHandler extends TriggerHandler implements AccountTriggerHandler.ITrigger{

    public AccountTriggerHandler(Map<Id, SObject> oldMap, Map<Id, SObject> newMap, List oldList, List newList){
        super(oldMap, newMap, oldList, newList);
    }

    public void bulkBefore(){}

    public void bulkAfter(){
        if (Trigger.isUpdate) {
           // your after update logic
        }
    }

    public void beforeInsert(SObject so){
		/// here is iteration on all records in trigger
	}

    public void beforeUpdate(SObject oldSo, SObject so){}

    public void beforeDelete(SObject so){}

    public void afterInsert(SObject so){}

    public void afterUpdate(SObject oldSo, SObject so){}

    public void afterDelete(SObject so){}

    public void postProcessing(){}

    public void postProcessing(){}
    	///// here you can set post processing logic (dml, sending emails, etc)
    }
}
If you want to go deeper into all of this, you can look at this article from the Force.com Cookbook:
http://developer.force.com/cookbook/recipe/trigger-pattern-for-tidy-streamlined-bulkified-triggers
3. Using future methods
In some cases, we don’t need to have the business logic working in real time. So, if we run into some troubles with limits, we can try and move part of our login, in the methods with the @future annotation. It works something like this, the code that is started from this annotation will have it’s own context with separate limits. Because it’s asynchronous, it has asynchronous limits (for example, it would have a 60 second time limit for a transaction, instead of the 10 seconds it would have in synchronical apex).
But you need to remember, that this also has some limitations. The Limit is 250,000 future method invocations per 24-hours (or the number of user licenses in your organization multiplied by 200, whichever is greater). And we also have to watch out, because Batch Apex, Queueable Apex, and scheduled Apex is also counted in all of this. So it could also make some trouble for us, if this is to be executed from every trigger invocation.
4. Nested loops
We need to be checking on our code when we are using nested loops. Sometimes we can’t avoid them, but sometimes we can.
Let’s take a look at a simple example, such as when we have a list of tasks, and we need to close all related Opportunities for them (from WhatId).
The simplest way to achieve this is to make two loops. But sure, it is also the worst variant for limits
public static void baad(){
 List<Task> tasks = [SELECT Id, WhatId FROM Task];
 List<Opportunity> opportunities = [SELECT Id, StageName FROM Opportunity WHERE IsClosed = false];

 for (Task tsk : tasks){
 for(Opportunity opp : opportunities){
 if (tsk.WhatId == opp.Id){
 opp.StageName = 'Closed';
 }
 }
 }
 ///continue logic
 }
A Much better way would be to replace the loop over the Opportunities, and then to retrieve it from Map by WhatId from Task:
	public static void better(){
		List tasks = [SELECT Id, WhatId FROM Task];
		Map<Id, Opportunity> opportunities = new Map<Id, Opportunity>([SELECT Id, StageName FROM Opportunity WHERE IsClosed = false]);

		for (Task tsk : tasks){
			if(opportunities.containsKey(tsk.WhatId)) {
				Opportunity opp = opportunities.get(tsk.WhatId);
				opp.StageName = 'Closed';
				///continue logic
			}
		}
	}
But like most things, this can also be optimized. You can get all the Id’s of the Opportunity from WhatId’s of Tasks, and then query the Opportunities. This will reduce the use of “Number of Soql records” and therefor it will be kinder to the limit usage.
public static void best(){
		Task[] tasks = [SELECT Id, WhatId FROM Task];
		Map<Id, Opportunity> opportunities = new Map<Id, Opportunity>();
		for(Task tsk : tasks) {
			if(tsk.WhatId != null && tsk.WhatId.getSObjectType() == Opportunity.SObjectType) {
				opportunities.put(tsk.WhatId, null);
			}
		}
		opportunities.putAll([SELECT Id, StageName FROM Opportunity WHERE Id IN :opportunities.keySet()]);
		for(Opportunity opp : opportunities.values()){
			opp.StageName = 'Closed';
		}
		///continue logic
	}
Now let’s compare the performance of these three methods, using The Welkin Suite Profiler.
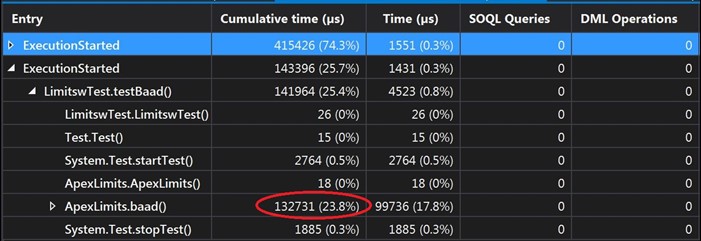
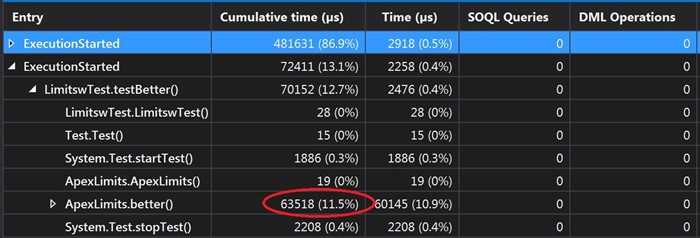
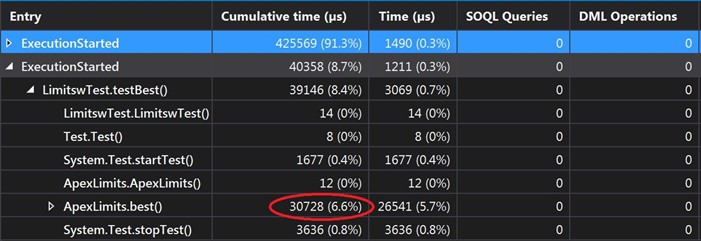
As we can see, on screen, there is a big difference between these approaches. The 3rd example takes 30ms to execute, but for the first solution it was 130ms, so, this means the 3rd example is four times better in CPU performance compared to the first one.
5. Using SOQL aggregation
Also to reduce some CPU time limits, we can use some SOQL aggregations (this is because the database time is not calculated into the CPU time). But we need to remember, and be mindful that SOQL aggregation queries are still counted in the total number of records retrieved by the SOQL queries, and this means that we could run into some limits here. So what we need to decide is which limits we can best sacrifice: SOQL rows or CPU time.
What we can do here is instead of using loops, is that we can use SUM, AVG, COUNT aggregate functions in the database to make our business logic. Also, we can explore options to the group, or we could create some sort of filtering at the database layer, and push our calculations at the database layer to reduce the chance of hitting a CPU timeout issue .
For all of this let’s consider an example. We need to count the number of closed opportunities by weeks in this calendar year.
NOTE: you can use The Welkin Suite Query Editor, to make big queries fast, really fast. One of the cool things that The Welkin Suite Query Editor does, is that it gives an ability to add fields by just clicking, and by doing this there is no more need to search for API names manually in an organisation, so, you will have a time to drink one more cup of coffee today!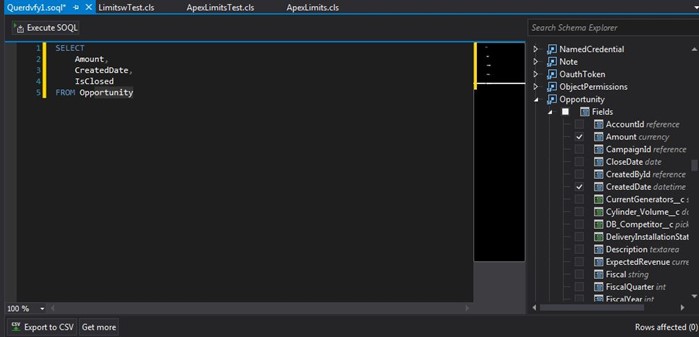
List<AggregateResult> query_results = [SELECT WEEK_IN_YEAR(CloseDate) week, count(Id) number FROM Opportunity WHERE IsClosed = true AND CALENDAR_YEAR(CloseDate) =: year GROUP BY WEEK_IN_YEAR(CloseDate) LIMIT 50000];
In the results of this query, we will get a list of AggregateResult, which stores the results that can be accessed by the alias which is defined in query.
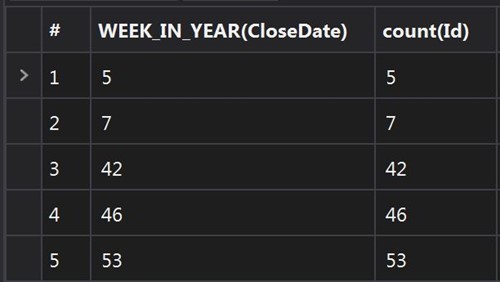
This can be found in this way: (Integer) ag_res.get('week') (Note, that data stored in Objects and should be casted to it type).
Here is how we can process which the results of the query:
 for(AggregateResult ag_res : query_results){
      system.debug(’week: ’+ (Integer) ag_res.get('week') +’  num: ’+  (Decimal) ag_res.get(‘number’));
///some logic
  }
So, if we run into some CPU time limit failure, we don’t need to worry, there is always something that can be optimized somewhere! And we must not forget to use The
Welkin Suite Profiler in this situation, as it will make our life much simpler. No more trying to find the proper place, time, and money to handle the resources to do all of this manually.
Of course, each of the solutions that we were talking about above has it’s own use case, and we all surely could look into our code right now, and more than likely we can find something to improve. Therefore, the best practice is to prevent any troubles before they could happen. This means, that we should probably be writing more bulkified unit tests, to check to see how our code is using the CPU time and other limits. Then we should get into the practice of “Putting the icing on the cake” in terms of our workflow when we write code, which is to, if we are using TWS, run the Profiler every time when we are finished running our tests.The Profiler can then show us how much of the limits each part of our code is using, and we can take care of any slowdowns before they turn into problems that come back and bite us.


Your comment may be the first