


Tracking of Salesforce Governor limits and debug logs in Spire R11
Do you often use Debugging possibilities? As of Spire R11, The Welkin Suite supplies you with even more possibilities, which will help you get rid of any errors in your code even faster! When debugging, you are now free to track the context of this process in accordance with the execution logs and check if Salesforce governor limits were used. As always, we have topped these updates with a few improvements and fixes that will make your life easier and more pleasant.
New abilities in Apex Retrospective Debugger
This time in Spire R11 version of The Welkin Suite for Windows, we have added several useful options to make your debugging process more clear and effective. Now you can track usage of Salesforce limits in your Apex code and check the execution process according to the logs step by step. Below we will show how to use these features in the IDE.
Check usage of Salesforce governor limits when you are debugging
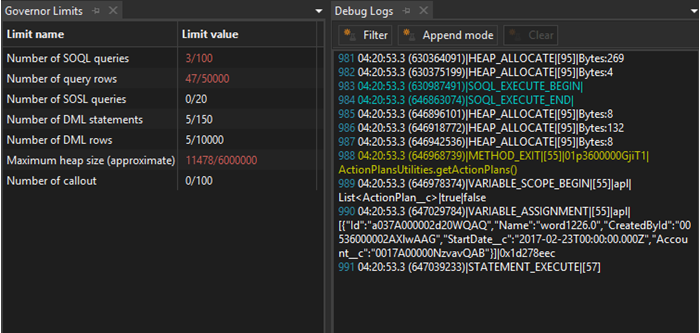
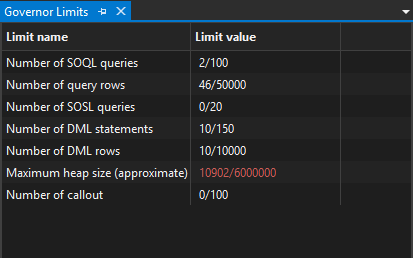
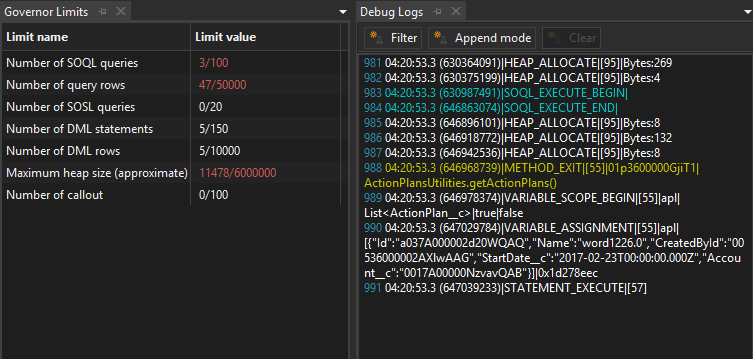
Developing for Salesforce is followed by lots of limits, and sometimes it is difficult to keep your eye on each of them while you are coding. We want to help you in this process - our developers have added the 'Governor Limits' panel, which is enabled in the Debug mode, and shows usage of the different Salesforce limits at the given step of your execution context. To open it, please navigate to the menu Debug -> Show Governor Limits.
This way of investigating your governor limits usage gives you a great opportunity to significantly reduce the amount of time needed to identify, resolve, and confirm any possible performance issues and bottlenecks - just go through your code step-by-step and you will see how the limits are used.
The information about the maximal limits is received from the appropriate Salesforce log file. Right now this functionality does not require you setting higher log levels in order to get profiling information - it is calculated from the log file itself. The supported Governor Limits in TWS are as follows:
-
Number of SOQL queries is calculated based on number of SOQL_EXECUTE_BEGIN entries
-
Number of query rows is calculated based on the corresponding numbers written to the log file in the SOQL_EXECUTE_END entries
-
Number of SOSL queries is calculated in the same way as SOQL queries - using the SOSL_EXECUTE_BEGIN entries
-
Number of DML statements is provided from the number of DML_BEGIN log entries
-
Number of DML rows is provided from the corresponding 'Rows' part of the DML_BEGIN entry
- Maximum heap size (approximate) is calculated using the HEAP_ALLOCATE entries, however, this approach does not provide absolutely correct numbers, so some kind of difference about 10-15% is possible and should be taken into account
- Number of callouts as well as most previous items is calculated by the number of CALLOUT_REQUEST items in the Debug Log file
By default, all of the maximal values are related to the synchronous limits, and if you step into the asynchronous context - they can be changed in-line to the corresponding values.
We would like to draw your attention to the fact that the value of a limit that has been changed is highlighted after each context execution so it will be much easier for you to notice any changes.
If you would like to learn more about Salesforce governor limits and getting past them, we have an article that will help you out.
Track the context of the debug process according to the execution logs
To make your debugging process more transparent, our developers have implemented gradual tracking of the execution process, according to the entries from the appropriate Salesforce log file. Now you can see the changes after each step, and catch every issue.
To enable this option, please open Debug menu -> Show Debug Logs. The separate panel will appear, and you can pin it to the spot that would be convenient for you.
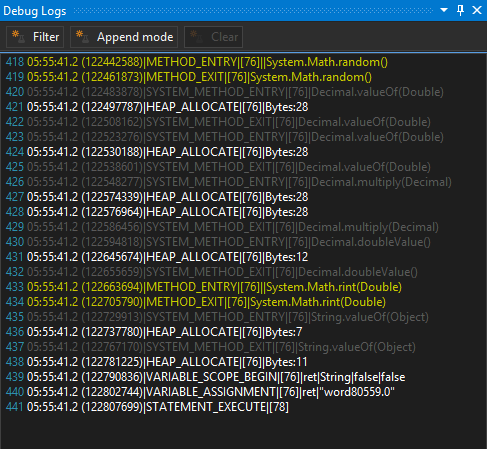
After each step in, step out, or moving to a breakpoint, etc., you will see the entries from the appropriate Salesforce log file with the described changes, which were done during the current execution. All the entries will be replaced in real-time after the next step. If in addition to the changes, you'd also like to see the cumulative process of debugging your test class, log, or Anonymous Apex, you can enable the 'Append mode', and log entries will be added to previous ones after each execution. You can enable this option at the top of the panel.
You can notice that the entries of Salesforce log files are highlighted in The Welkin Suite according to their types and categories. This applies to the Debug Logs in the Debug mode as well. In addition, you can filter the entries to see only the necessary ones. The Filter option is present at the top of the panel too.
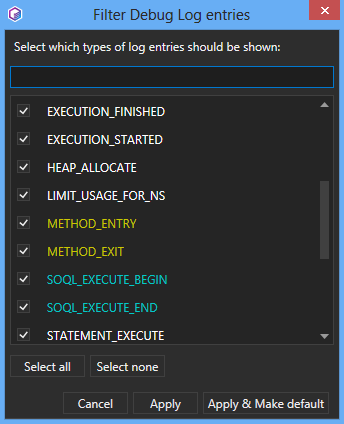
The types of the entries in the Filter menu are highlighted for easy navigation between them. When you select the needed entries types for displaying for your Salesforce log in the Debug mode, you can apply them to the current log file, or make them default for all further debug sessions by selecting the appropriate options in the wizard. The 'Apply & Make default' option will also be enabled by clicking 'Enter'. In addition, you can use the 'Select all' or 'Select none' filter for the list of entities types.
In addition, when necessary, you can remove all the entries which are present in the panel using the 'Clear' option.
Improvements
In terms of the described changes related to Apex Retrospective Debugger, we have also made some changes to the Debug Log Viewer - you can use the same filter for debug log entries (which we have implemented for Debug Logs in the Debug mode) in your Salesforce logs, which are opened in the Log Viewer also that is. This means that now you can select the types of entries that you want to see for any Salesforce log file.
In The Welkin Suite Spire R11, we have updated the version of the used API provided by Salesforce, to give you more abilities in your working process. Now all the benefits and additional opportunities of v. 39 of Salesforce API are supported in the IDE, and you are able to use all the updates from Salesforce in your TWS projects.
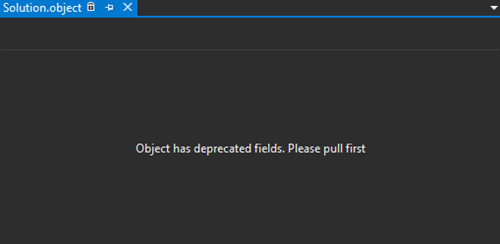
In a frame of these changes, one of the Salesforce's updates is related to the Picklists fields in sObjects. This type of field is replaced with the ValueSet beginning from v. 38 of Salesforce API. That is why, when you would open an object file in your existing TWS project, your would be asked to make the pull from Salesforce to update the fields to the actual type and value. This will be applied only to the objects which have Picklist fields inside. The xml editor will be locked, and you will see the appropriate message about the needed pull. During the pull process, all of the objects with Picklist fields will be updated automatically, and you will have the most recent and valid information from the server.
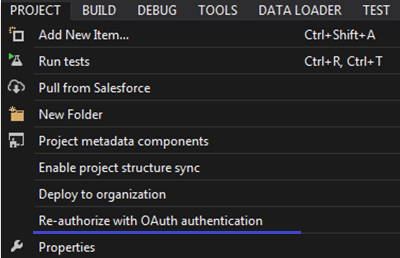
TWS users who've used the OAuth authentication for their projects, can manually force the refresh of their credentials, beginning from the newly released version. When you get the error about the failed login to your Organization, or that the credentials are incorrect, please open Project menu and select 'Re-authorize with OAuth authentication'.
After this, please login to your Salesforce Org and continue the working process within The Welkin Suite IDE.
Fixes
In Spire R9 and Spire R10 versions of the IDE, you could have been faced with the error when you run a test from the code editor or when you started debugging from test class when the Test Result panel was closed. The reason for this was related to opening test results without UI thread. To avoid the issue this was necessary to open the panel manually. Now you can use your usual TWS UI to execute the mentioned operation without any errors.
The next change is related to user's rights which don't allow to update files on an Organization. In this case, now you will see the correct error about the insufficient permissions as a reason for the failed saving of your files on the server.
The results for a number of DML operations and SOQL queries in TWS Profiler were incorrect. Our developers have solved the issue, so now you will get all the valid data after profiling in your project.
The creation of Wave projects was blocked in The Welkin Suite after your Organization was moved to the Spring'17 version of Salesforce. We have solved this issue in Spire R11.
In the previous version on The Welkin Suite Spire, we added support for the Letterhead metadata. This time, we have solved the found issue when you disabled it in the 'Project Metadata Components' wizard, but anyway it stayed enabled and was added to your project after the next pull from Salesforce.
Our developers have solved the failed start for the debugging process of a log file. This was applied for the case in the log contains several execution contexts. The IDE couldn't find the correct start point for debugging and the process was failed. Now such issue won't worry you and you will get all the needed information.
When you create a field with the picklist type in your object, you can select values for it. The states for these values can be Active or Inactive, so our developers have removed the third state that cannot be applied for these settings.
One more issue was related to another option in sObject Editor and it was present in the Layout tab. We have fixed TWS crash that was reproduced when you selected any item in the filter settings after clicking 'Select none' option.
Spring is on the way - and our upcoming updates will help you nurture your code even better! Would you like to help us turn The Welkin Suite into an IDE of your personal dream? Share your feedback and ideas with us, subscribe to our Sandbox program, and we would love to hear you out!
Full list of changes
Features
- Implemented tracking of Salesforce governor limits in the Retrospective Debugger perspective
- Implemented an ability to see execution logs during a debug session to understand a context better
Improvements
- Extended an ability to filter debug categories in Apex Log viewer
- Moved to the API v.39 provided by Salesforce
- Added an ability to refresh/change OAuth credentials for TWS project manually if they are expired or incorrect
Fixes
- Added displaying the error about insufficient user's permissions on an Organization as the reason for the failed build process
- Fixed the error during a test-run job or starting to debug from a test class if the Test Result panel was closed
- Fixed the incorrect amount of DML operations and SOQL queries in Profiling results
- Fixed the failed creation of Wave projects
- Fixed the issue when the Letterhead metadata stayed enabled in the 'Project Metadata Components' after you disabled it
- Fixed the failed start of debugging process if there were several contexts inside a Salesforce log file
- Removed the incorrect state for values in the picklist fields settings
- Fixed typos in TWS messages

Your comment may be the first