


The Welkin Suite IDE 0.28.2 - Release Notes
Have you already tried the Apex Retrospective Debugger inside The Welkin Suite? In the newly released 0.28.2 version, our team is proud to introduce the new features and major improvements concerning, but not limited to our awesome Debugger! Meet The Welkin Suite with the options to step back in the Debug Mode, and debug the Anonymous Apex files, and several more changes. The extended abilities of the Apex Log Viewer with the tree view of your logs will help you to get full information about the execution of your code. Let's take a closer look!
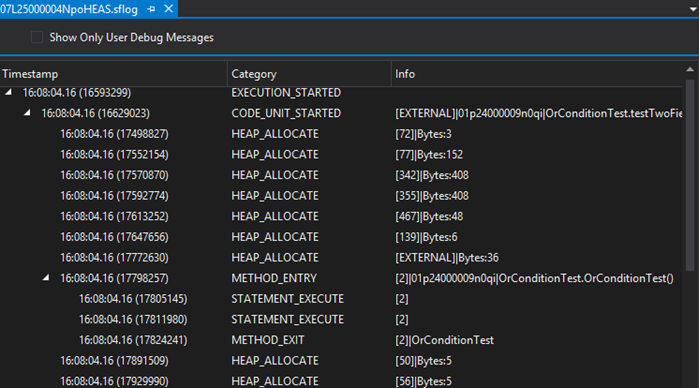
Tree view for the Apex Logs Viewer
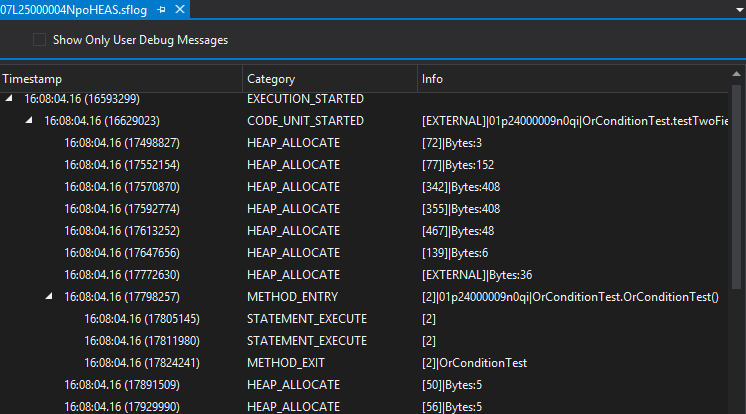
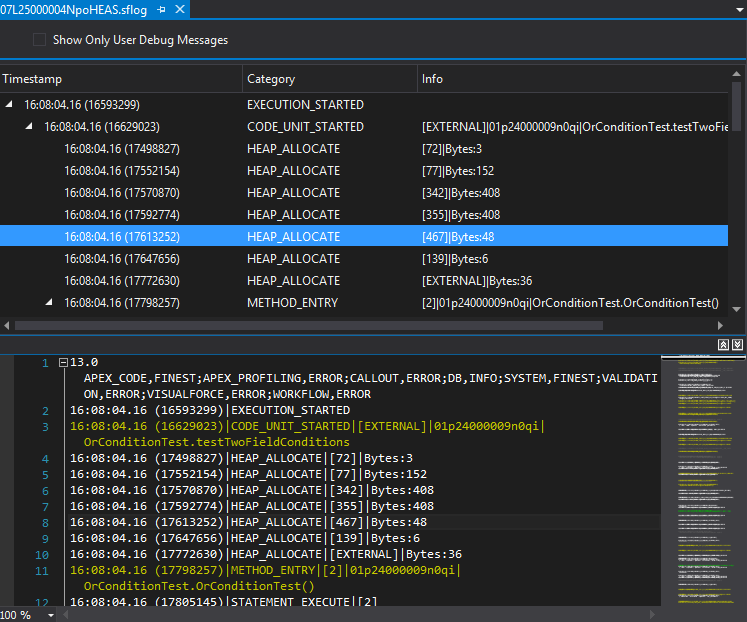
Starting from the 0.28.2 version of The Welkin Suite, the logs are displayed in both the tree view and the line view in the same window. You can download the Logs from Salesforce in the Logs panel and open any log file in the editor. As a result, under the usual chronological line view, you will see all the events arranged by their relationship of dependence to one another. In addition, your current position is highlighted in the line view whenever you change it in the tree view, so you will never get lost in the logs. With the help of these features, going through the logs becomes more convenient, while you are able to find necessary information faster.

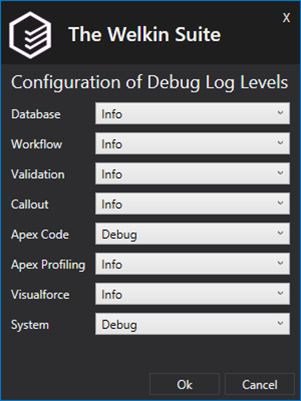
Configuration of the Debug Log Levels in TWS
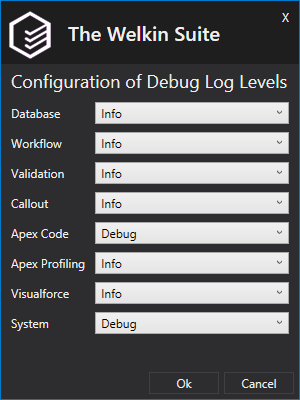
We appreciate lots of your feedbacks related to the Logs functionality of The Welkin Suite, and our goal is to make your work with it as much comfortable and efficient as possible. Starting from this version, you are able to set Debug log levels directly in the IDE without switching to Salesforce settings. This option is available on the Logs panel. To open it, go to the Main Menu -> View -> Logs Window. To change the log level click on the button 'Configure Debug Log Levels' and select a necessary level for the type of log that you need. To apply the setting click the 'OK' button.
This option helps you to save your time and concentrate on developing without switching between other applications or services.
The last state of the 'Show Only User Debug Messages' option
Now you don't need anymore to filter the logs to only debug messages each time you open them.The option 'Show Only User Debug Messages' remembers its last state in the current session, so the setting is kept the same that you've selected previously. When you start the new session in The Welkin Suite, the setting for this option returns to the default state — the filter is unselected.
Debug from the Anonymous Apex file
In the newest version of the IDE, we increased the list of the supported file types, which the Debugger can work with. In addition to the currently available abilities to launch the debugging from any unit test or a log file, now you can also start the debugging for any Anonymous Apex file.
When you want to test new functionality without deploying it to Salesforce, the Anonymous Apex files are the best solution. And now you get an extra tool to verify the execution of the code in your Anonymous Apex file.
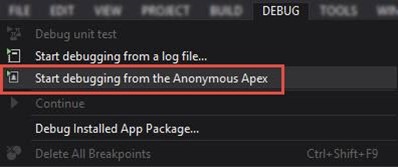
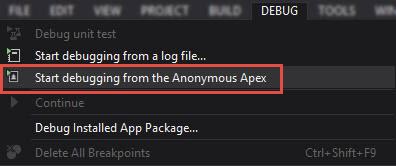
You can create these files using the Add -> New Item commands in the project's context menu. Just open your created Anonymous Apex file in the editor, and The Welkin Suite will offer you two ways to start debugging it:
- from the Main Menu: go to Debug -> Start debugging from Anonymous Apex,
- from the context menu: right click on the opened file in the Editor and select the 'Debug Anonymous Apex' option.
Both of these options will start the Debugging process, and allow you to go through the code execution step by step.
Navigation backward in the Debug Mode
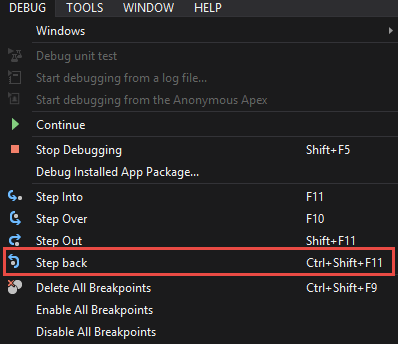
The great update of the Debugger functionality — now it also includes the ability to navigate backward in the Debug Mode. In case you missed some necessary point, you can easily go back through the execution context. This option, like all the navigation steps, is available from the Main Menu item Debug -> Step back, from the Debug panel with the help of the 'Step back' button, and by pressing the Ctrl+Shift+F11 hotkey.

Exceptions in the Debug Mode
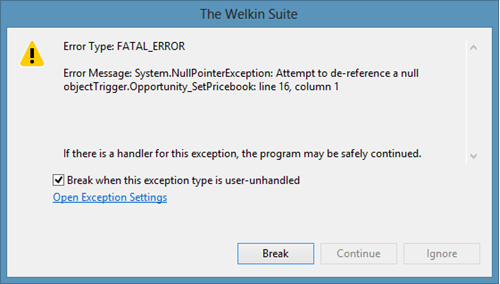
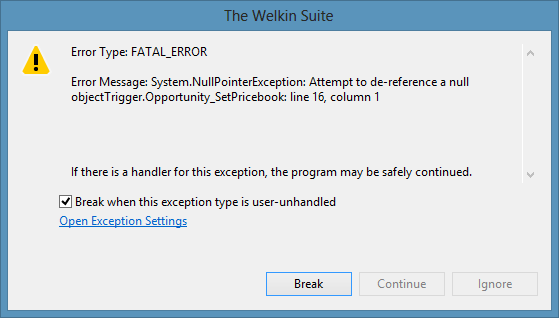
Now the Apex Retrospective Debugger helps you not only to trace the whole execution flow but also to catch all the exceptions and errors within your code. When the debugging process reaches any exception, you will get the dialog box with a notification, an error message, and a tip about a type of an error. There are two types of these errors:
- Exception Thrown — a handled exception; in this case, you can break the debugging to explore the issue or continue debugging,
- Fatal Error — an unhandled exception; the Debugger shows a notification only with one available option 'Break'. After you've pressed the 'Break' button, you will see the notification page with a message that the code is not running. To continue debugging you should use the navigation options, but to make your code valid you should solve the current issue.
You can easily discover the execution of your code and find all the points that may cause issues with the help of this functionality
Improvements in the Apex Retrospective Debugger functionality
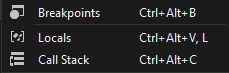
Our work on the Apex Retrospective Debugger continues. Now in the Debug Mode you are able to open / close any of the Debugger's panel if needed: the Breakpoints panel (Ctrl+Alt+B), Locals panel (Ctrl+Alt+V, L), and Call stack panel (Ctrl+Alt+C). In addition, the Breakpoints panel is also available outside the Debug Mode. Access to these options you can find in the Main Menu: Debug -> Windows, and with the help of the 'Windows' button at the Debug panel.

Please note, if you have installed The Welkin Suite earlier, these options may not appear in the Debug Menu. In such a case, you need to reset your user setting. Go to the Main Menu -> Tools -> Import and Export Settings. Select the 'Reset all settings' option, click the 'Next' button and then 'Finish'. Please note, this action will cancel all your custom settings in TWS.
Also, the Locals list in the Debug mode now includes not only custom local variables but also the properties with all the related data. Similar to the locals, the properties in the Locals panel may have different nesting levels.
Our team implemented the support of the address value for the custom types of your Locals. If this value is specified, you will see it in the Locals panel in the Debug mode.
In addition, we improved the UI for your convenience. We added the shortcut keys for the Debugger's navigation buttons to the Main Menu, so now you no longer need to remember all the combinations.
As the final stroke, now all your opened files in the editor are locked when you starting the debugging. Thanks to this, you can easily avoid any unexpected changes caused by a system process, for example.
Other changes
In the newly released version of the IDE, our team fixed the issue with the options 'Step Over' and 'Step Out' failing to stop on the breakpoints located inside the method that is executed by the Debugger. As of now, all the breakpoints you set will be included in the debugging process correctly.
One more fix is also related to the debugging functionality. If you are going through the nested method with several 'Code_Unit_Started' blocks, each of them will be present in the Call Stack in the Debug mode.
Future plans
Of course, we are going to make the Apex Retrospective Debugger better and to extend its functionality further. We will add the new abilities to your work with the Salesforce Logs as well.
And our team is already preparing the next major updates for the future releases!
Share with us your suggestions and feedbacks about The Welkin Suite and we will be glad to bring them to life. Choose any convenient way to do it: Forum, Twitter, LinkedIn, Facebook, Google+.
Full list of changes
New Features
- Added the option to start the Apex Retrospective Debugger from the Anonymous Apex files.
- Implemented an ability to navigate backward during the Debugging process.
- Implemented the tracking of exceptions in custom code during the Debugging process.
- Implemented the Tree view of a log in the split editor.
- Implemented an ability to configure the org-wide Debug Log levels.
Improvements
- Added properties to the list of Locals during the Debugging process.
- Added address values for the Locals of the custom types during the Debugging process.
- Added the Debug related panels into the Debug menu.
- Added the hotkeys to the Debug navigation in the Main Menu.
- Improved the performance of the parser during the work with the Debug logs.
- The file opened in the Debug Mode become locked for the other processes.
- Implemented the saving of the last state of the 'Show Only User Debug Messages' option.
Fixes
- Fixed the issue related to the missed breakpoints inside the methods when using the 'Step Over' and 'Step Out' options during the Debug process.
- Fixed the issue related to the incorrect entries in the 'Call stack' panel if there are several 'Code started' blocks in a method.

Your comment may be the first