


Debugging Options
Similar to any type of coding, in Salesforce development the code is the landmark of each developer. This brings keeping the code clean and bug-free to the forefront. For this reason, we added a set of Debugging features to The Welkin Suite IDE - to automate the process of finding and fixing problems in your code.
Debug Logs
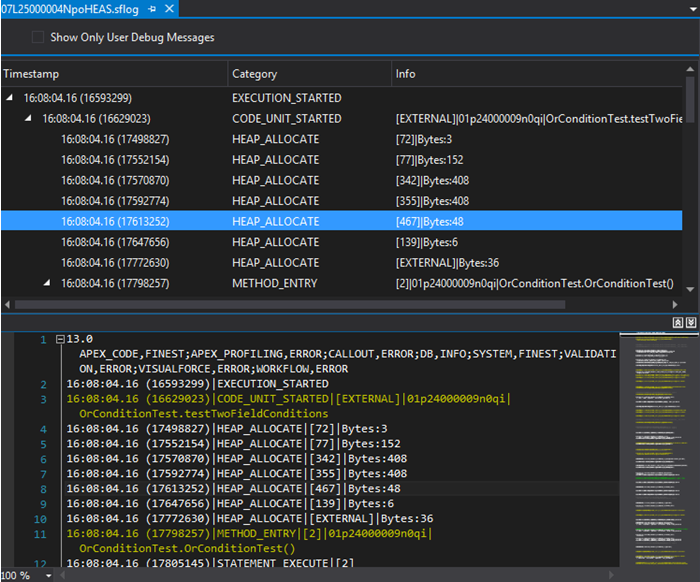
In The Welkin Suite IDE, you can automatically get the latest logs from Salesforce to find and fix the issues in your code. With a large number of executed actions, the number of logs to be downloaded is immense, so we included an option to poll them automatically from each opened project. This way, you will always have the latest logs to process directly in our IDE, without having to use the browser or external applications to get and open them.
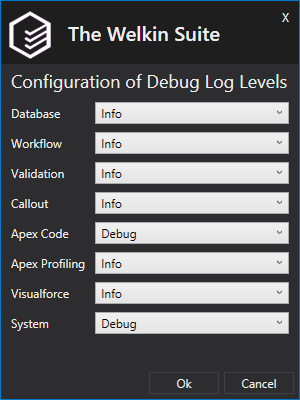
Also, you can configure the Debug Log Levels directly in our IDE, which comes in handy when you need or could go without maximum detailing.

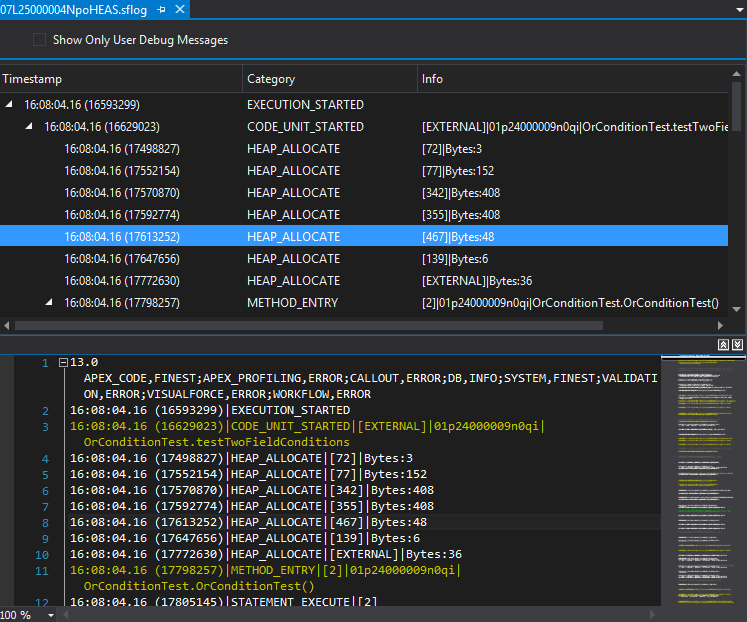
To help you find the necessary information even faster, we included an option to display the logs in both the tree view and the line view in the same window.
Apex Retrospective Debugger
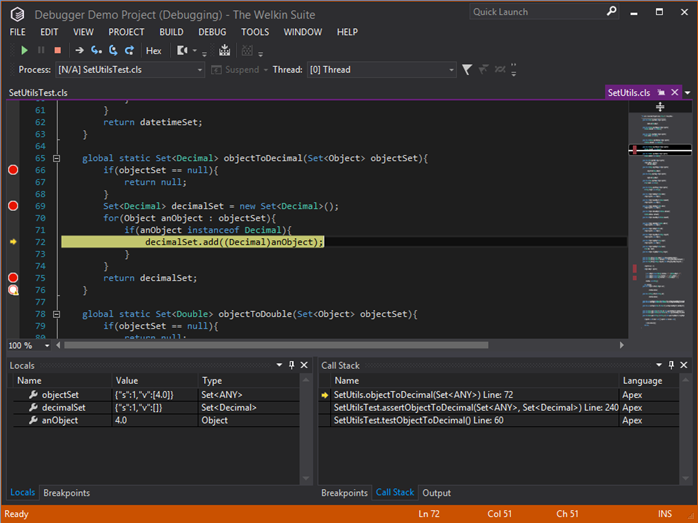
Watch the step-by-step execution of all the operations and calls, analyze your code and understand the principles behind the work of your code better with the help of The Welkin Suite’s Apex Retrospective Debugger. This tool makes use of the data received from the Debug Logs, and thus allows you to reproduce the execution of your code, and trace which lines of your code were executed exactly, monitor the state of the call stack, construction calls and methods, and keep track of all the actions.
The great thing about this feature is that you can debug virtually everything - from any Unit test and Anonymous Apex file to every single Debug Log file you have.
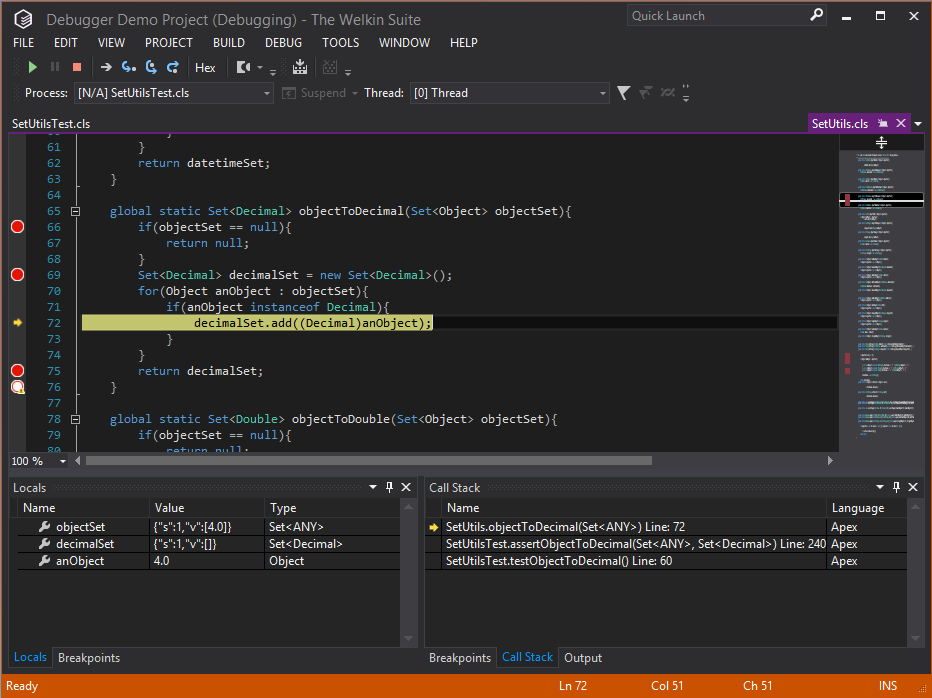
Once you initiate the Debugging process, The Welkin Suite immediately switches to the Debug Mode. This mode provides the access to the editor with the code, allows working with breakpoints, navigating through the code using 'Show the next statement', 'Step into', 'Step out', 'Step over' and 'Step back', offers a list of locals in the active part of the code, and, finally, provides an ability to trace the execution in a call stack.
Apex Test Runner
Since Salesforce imposes strict rules onto code coverage, it is essential that your code is covered by tests. Logically, it is always best to have both the tests and the code working flawlessly - after all, the development is all about making things work properly. Therefore, The Welkin Suite offers a convenient Apex Tests Runner tool, which lets you run tests and monitor the results in the most convenient manner. What makes the whole process even better is the fact that you can run the tests on the background, while coding - without any performance losses.
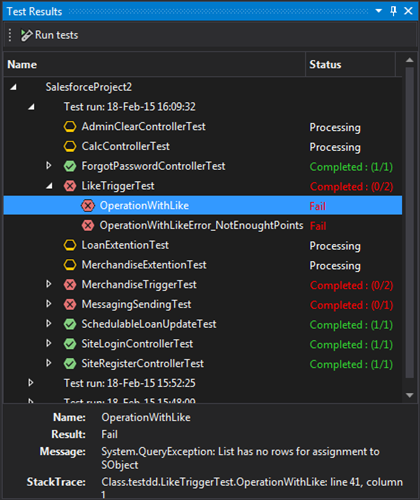
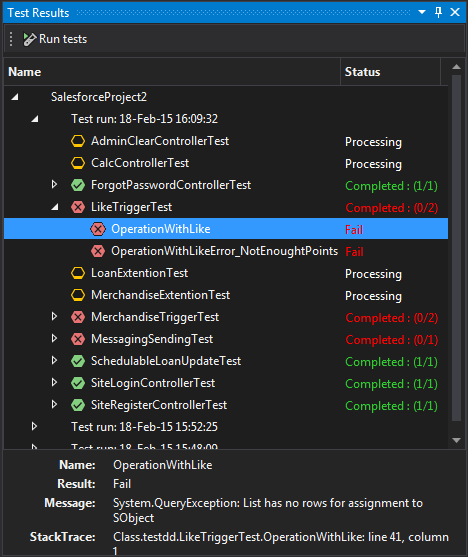
The IDE provides a separate panel with all the data on the current and previous Test Runs, as well as the real-time information about the tests that are in progress at the moment. In addition, the panel displays the information regarding the failed tests, namely, the log info, error messages and stack trace.
With the help of these tools no bugs in your code will escape your inspection!
For more data on the technical aspects of Debugging in The Welkin Suite, please check this post.

https://euweedfarm.com/
https://euweedfarm.com/cali-weed-kaufen/
https://kokainhaus.com/
https://beuhferme.com/
https://nicekok.com/
https://nicekok.com/kokain-preis/
https://nicekok.com/koks-kaufen/
https://pilzeshroom.com
https://pilzeshroom.com/magic-mushroom-shop
https://kokainhaus.com/nl/
https://kokainhaus.com/en/
https://kokainhaus.com/es/
https://kokainhaus.com/it/
https://ko-tropfen.com/
https://ko-tropfen.com/diazepam-kaufen
https://drogenplatz.com/
https://drogenplatz.com/lsd-kaufen/
https://drogenplatz.com/ecstasy-kaufen/
https://drogenplatz.com/xanax-kaufen
https://drogenpalast.com/
https://drogenpalast.com/amphetamin-kaufen/
https://drogenpalast.com/crystal-meths-kaufen/
https://pillenlabor.com/
https://pillenlabor.com/mdma-kaufen
https://hallushroom.com
https://hallushroom.com/magic-mushroom-shop
https://ketaminhaus.com