

Apex Profiler
Instantly analyze the performance of your code with the help of Apex Profiler in The Welkin Suite IDE.
This handy feature allows you to run any test as many times as you would like to in order to receive all the necessary information on the execution time. To help you gather the necessary data during the test run process, The Welkin Suite IDE backs up your log levels, adjusts them in accordance with your preferences, then executes the tests as many times as you have specified, and finally sets the log levels back to the way they were before.
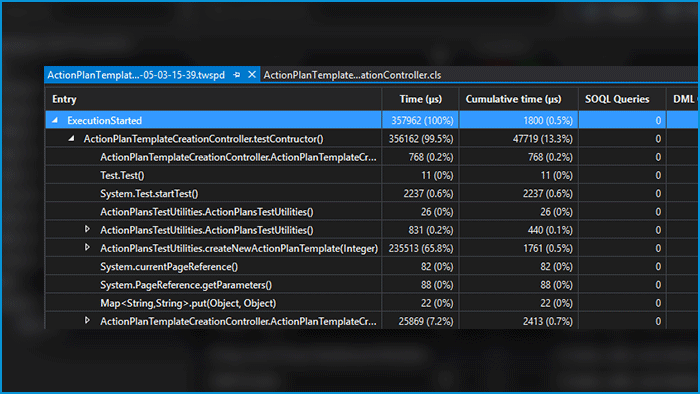
All of the results of the test runs using the Apex Profiler are displayed in the editor. The results include the entry, the execution time in milliseconds, the cumulative time, SOQL queries, and DML operations - all of which are shown in the call stack view that lets you trace the execution path.
Features
Org Configuration
Apex Development
Lightning & Visualforce Development
Boost Your Productivity. Get Started Today
Try Free Trial